
Do technical trading patterns exist and are they profitable?
This is a question often asked by new traders.
Depending on who you ask, the response will differ. Some academics and investors believe patterns don’t exist – that price action is entirely random, whereas the majority of technical analysts are adamant chart patterns exist and are profitable.
Ultimately, it is down to you to decide and prove for yourself which side you support.
What is a pattern?
Among the technical community, the term pattern (or sometimes referred to as formation) is a configuration of bounded price action, either by support and resistance lines or trend lines. As such, understanding how to correctly apply trend lines and support and resistance levels is necessary.
Chart patterns, be it on candlestick or bar charts, can form on any time period. This is the fractal nature of the markets. A chart pattern can occur on the hourly chart, though it can also form on the weekly, daily and even M5 charts, too. Bear this in mind as we proceed through each pattern.
In all cases, though, chart patterns finalise when a breakout ensues. The breakout, of course, may be false, which is where a number of newer traders often get caught out. Another point worth highlighting is chart patterns are not exact models. In other words, a formation seldom mirrors previous representations. They will offer similar characteristics but will never be exactly the same configuration.
In addition to the above, the subject of continuation chart patterns and reversal chart patterns is often voiced and is certainly a topic to be aware of. Continuation patterns do what the name implies: forms and breaks in the direction of the current trend, while a reversal pattern breaks in the opposite direction of the trend it established within.
Classic chart patterns
The trading range:
Consisting of a resistance level plotted above price action and a support level below, the trading range, or rectangle formation, is one of the simplest chart patterns occurring in markets.
Each support and resistance line must be tested at least twice to qualify. Price action, as shown in figure 1.1, is bounded and oscillates between the limits until a breakout in either direction occurs. Figure 1.1 demonstrates a trading range within an uptrend.
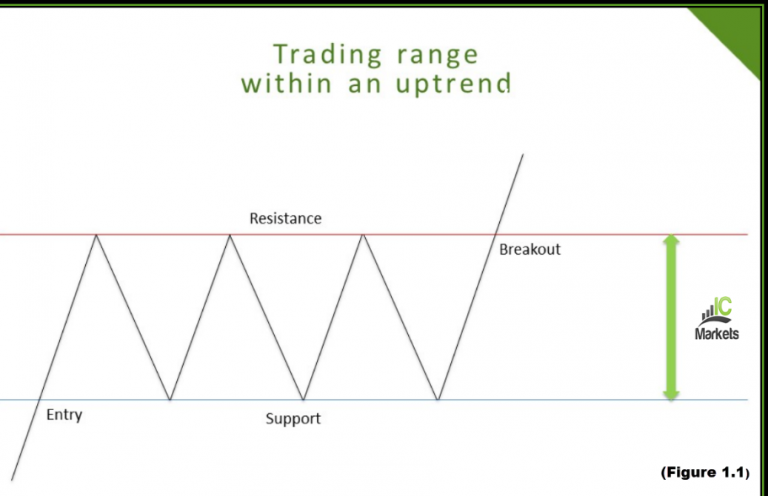
Within a rectangle pattern, traders cannot expect the tests of the outer edge to be to the point. It will vary, though it’s always best to look for those formations resembling a tight consolidation.
Another point to watch for is buying and selling momentum. For example, a test of the upper edge of the range that fails to reach its opposing support can indicate a lack of selling pressure, thus suggesting a breakout to the upside is potentially in store.
Figure 1.2 shows a rectangle formation that broke out to the downside on a GBP/JPY M15 chart:
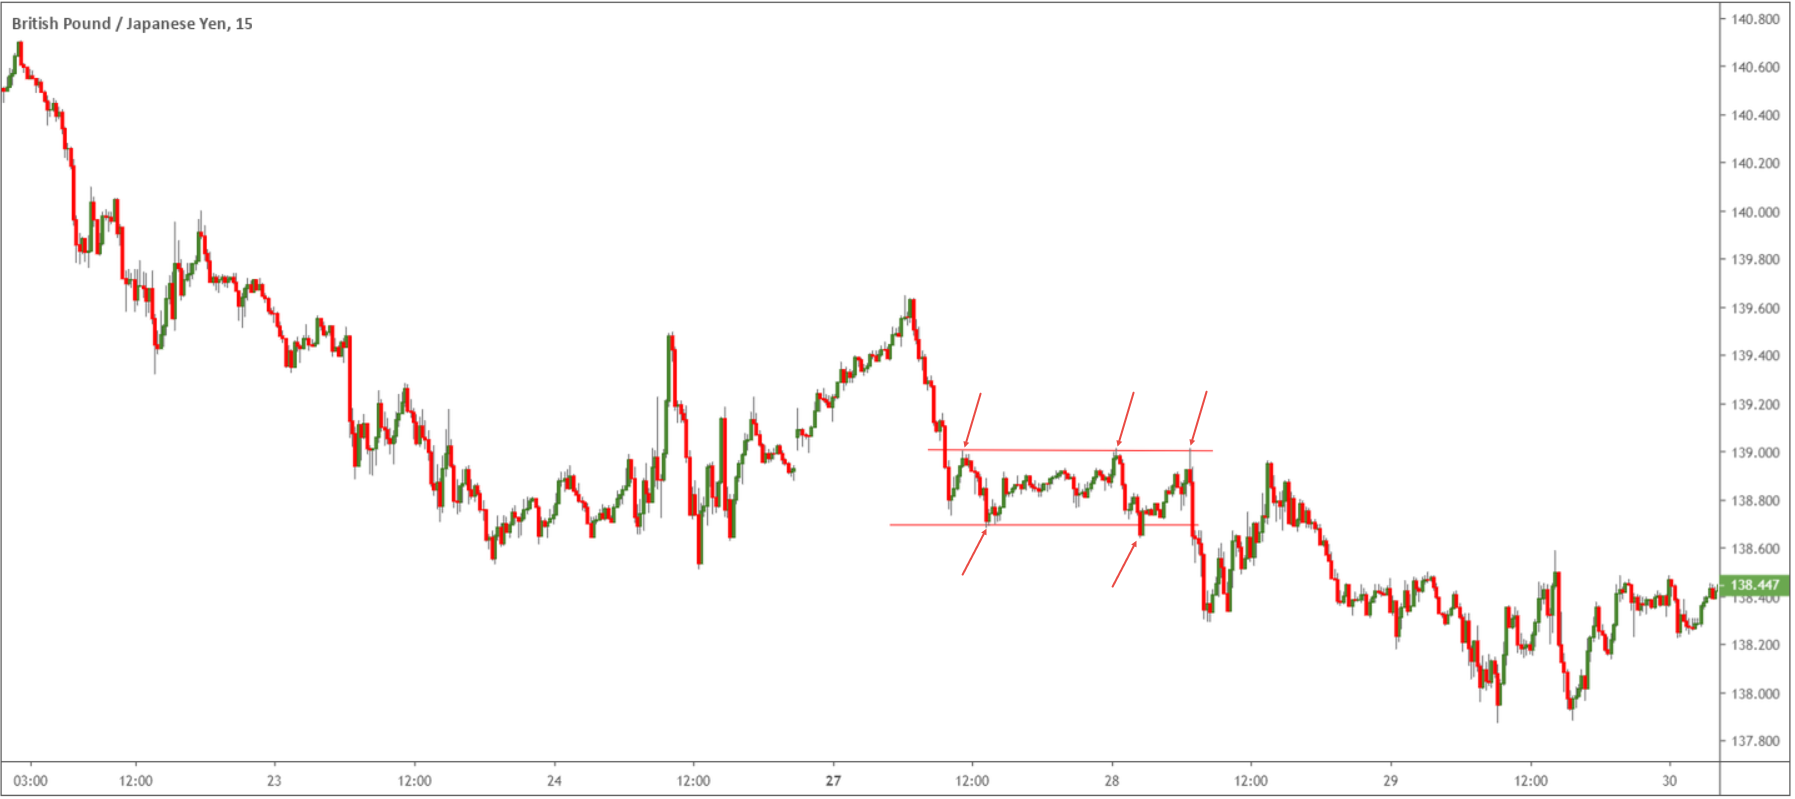
(Figure 1.2)
Trading rectangles:
Many traders consider these formations a continuation pattern, though they can also form at tops and bottoms as reversal structures.
Some traders will trade within the rectangle, entering long at the lower limit of the range and targeting the opposing edge, and vice versa. This is difficult unless the rectangle is of sufficient size. Other traders attempt to trade the breakout. Traditionally, this is done in two ways: either buy/sell the breakout candle or wait for a correction to form following the breakout. The former is generally a chancy move, as fakeouts are common and usually catch newer traders off guard. Waiting for the retest to develop also allows traders to enter on the back of Japanese candlestick confirmation, offering additional confirmation on top of the retest motion.
As for take-profit targets, traders calculate this by adding the height of the rectangle formation to the breakout price. However, should a large support or resistance structure be visible before this target is reached, it’s generally best to include the said level in your analysis as well.
Double top and double bottom:
Double top and bottom formations consist of three reversal points: two peaks/troughs separated by a trough/peak, as shown in figure 1.3.
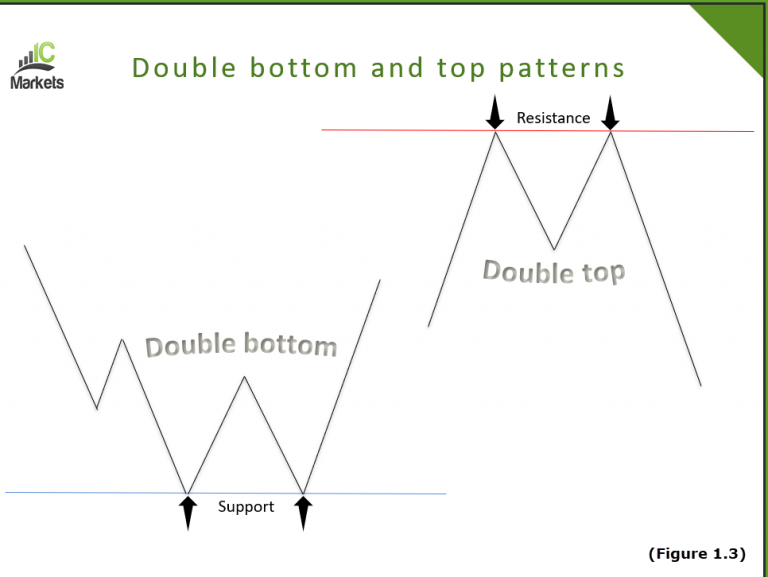
Though simple in structure, newer traders often incorrectly interpret when to trade the pattern.
A valid top pattern has to have price action enter from below the trough price, and vice versa for a bottom formation. According to many traders, ideal patterns form what is called an ‘Eve and Eve’ configuration, meaning the tops and bottoms are rounded and wide. In addition to this, the peaks and troughs should form within 5% of the preceding peak/trough.
Double top and bottom patterns are reversal configurations, occurring after extended up/downtrends. Therefore, they can determine a major trend reversal and also be used to enter the current trend.
A true formation is valid when the trough (sometimes referred to as the ‘neckline’), in the case of a double top, has been penetrated. Once this area is clear, further selling is likely in store (see figure 1.4). The same goes for a double bottom, only look for the peak to be engulfed.
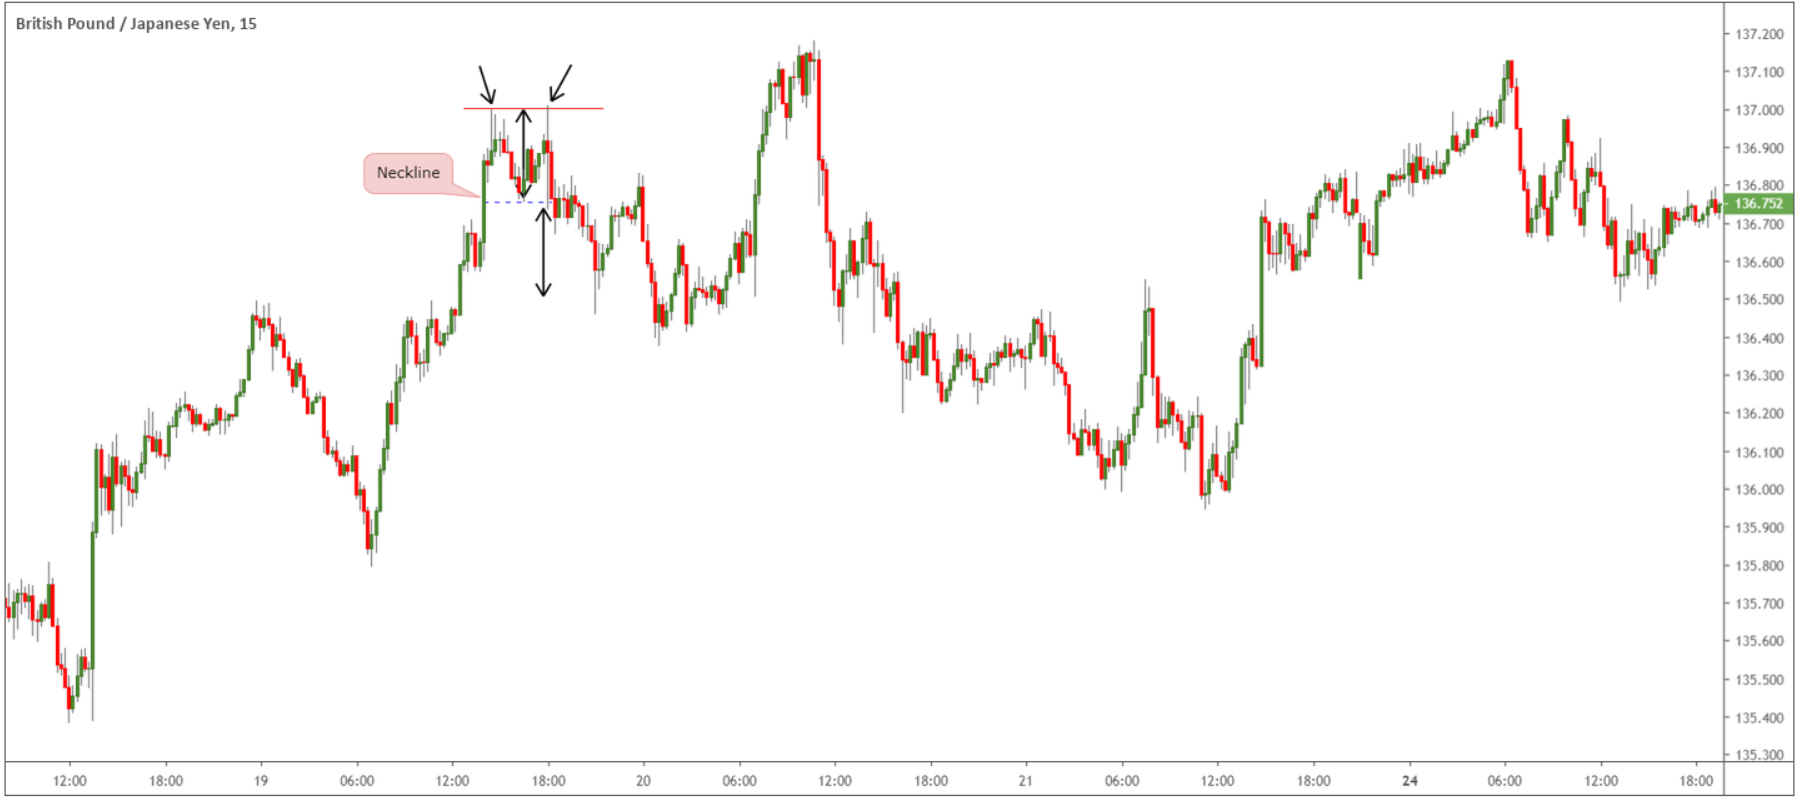
(Figure 1.4)
Trading double bottom and top patterns:
First things first is to identify two valid peaks or troughs and its associated neckline. It’s paramount not to trade the formation until the neckline is penetrated: a breakout.
Once the breakout is visible, a trade on the back of the breakout candle is an option, or for more conservative traders, a trade on the retest of the neckline. Waiting for a retest to develop, similar to rectangle trading, leaves the door open for additional Japanese candlestick confirmation. The latter approach, though, while typically the safer route, can sometimes run the risk of leaving the trader behind. That’s the price you pay for additional confirmation.
The take-profit target, similar to the rectangle formation, forms by computing the height from the highest peak (in case of a topping pattern) to the trough, and adding this value to the breakout price. Again, this is only one way of calculating a take-profit target. If structure – a support or demand for example – is also visible, make sure to include this in your analysis, too.
Triangles:
While the rectangle formation forms using parallel support and resistance levels, triangle patterns form using both support and resistance levels as well as trend lines. Although a number of different constructions exist, two of the most popular triangles are the ascending and descending configurations.
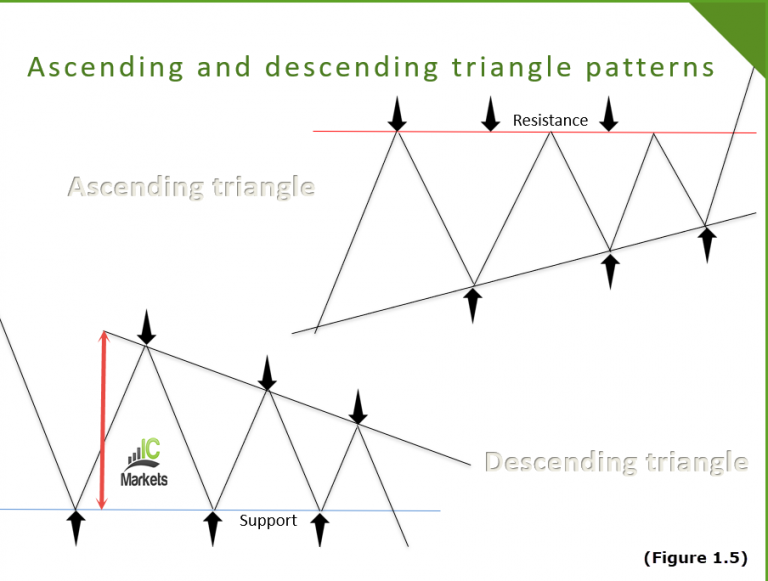
The ascending triangle has its upper limit bounded by a resistance level combined with an upward sloping trend line support. A descending triangle is the opposite with its lower boundary limited by a support level that’s shared with a downward sloping trend line resistance, as shown in figure 1.5.
For an ascending or descending triangle to be valid, price movement should test each line at least twice, and generally fill the entire space (or as near as possible) of the pattern. Technicians label the point at where the two lines converge as the apex and the distance between the support (in the case of a descending triangle) and the initial reversal point as the base (red arrow – figure 1.5).
(Figure 1.6)
Trading ascending and descending triangle patterns:
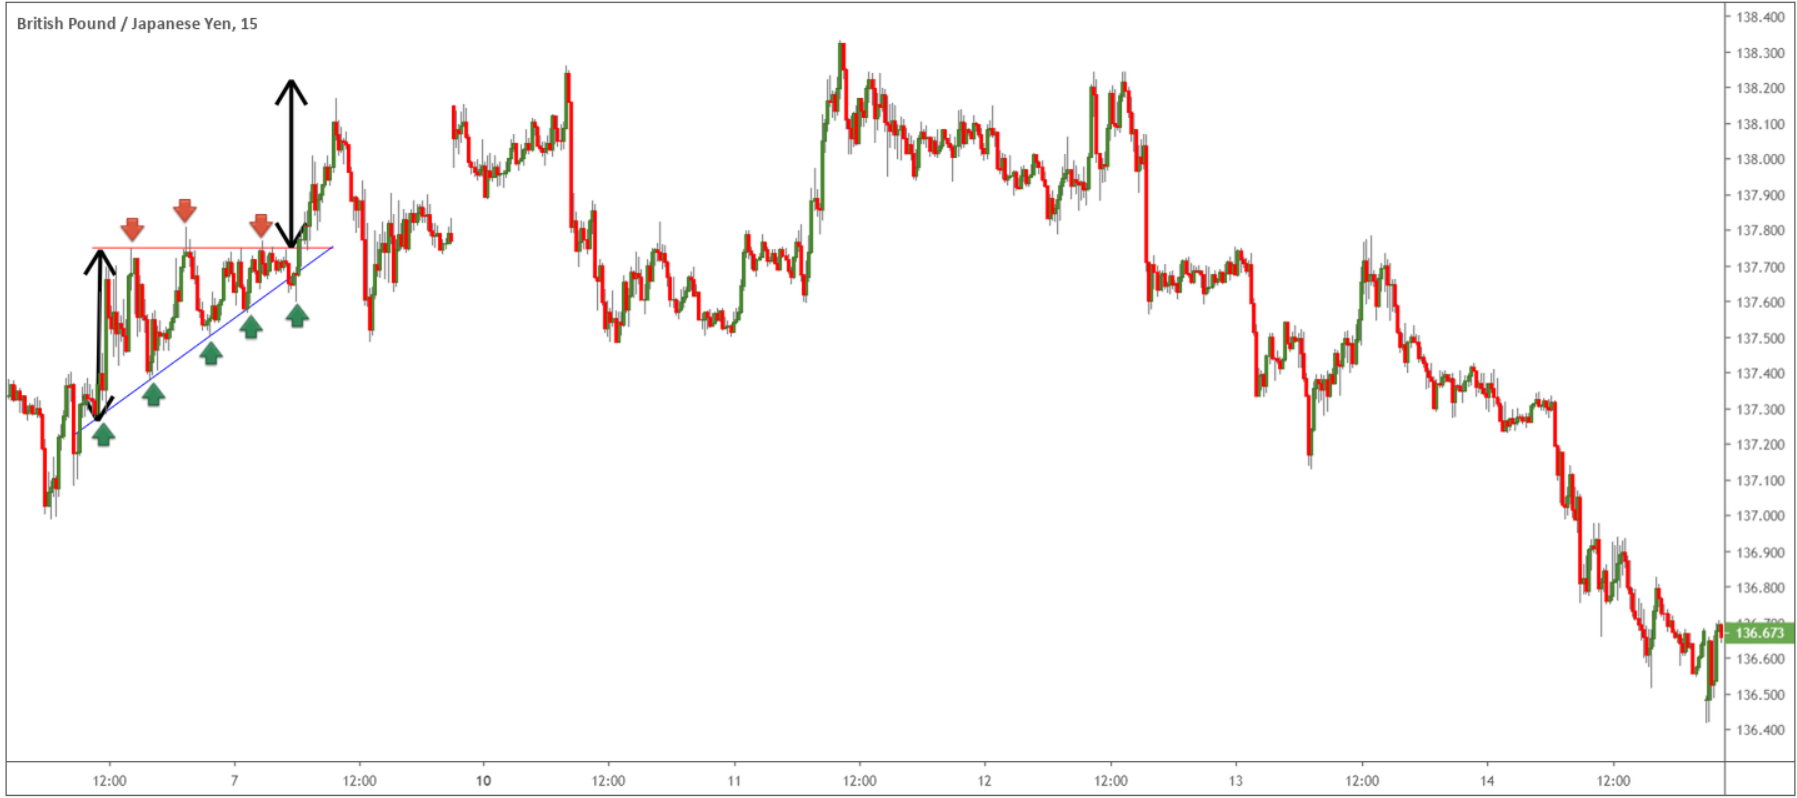
The ideal scenario for trading triangles is on a decisive breakout. Like the rectangle and double top/bottom patterns, traders, at its most basic, have two choices. The first is wait for a defined breakout to occur and trading on the close of the candle with stop-loss orders either positioned beneath the breakout candlestick’s lower shadow or beneath the ascending trend line support, in the case of an ascending triangle. The second is to wait for a retest to occur following the breakout – if you look closely, figure 1.6 actually shows a retest play take shape prior to pressing higher.
Figure 1.6 also demonstrates a clear ascending triangle pattern exhibiting a number of tests and filling the entire space of the formation. The breakout followed through with some continuation, though failed to achieve the take-profit target – it fell short by five points. In regard to calculating the take-profit target, traders simply measure the base distance and apply this to the breakout point (black arrows – figure 1.6). Once again, nonetheless, always ensure additional technical considerations are taken into account.
Going forward…
To answer the question whether chart patterns exist and if they’re profitable, yes, they most certainly do exist and for some traders have been, and continue to be, profitable. According to many successful traders interviewed over the years, it is not the technical patterns that generally causes failure, it is the trader. Chart patterns present themselves and will offer similar characteristics to the preceding patterns that developed, but the individual outcome will be random, which remains a difficult piece of the puzzle for many traders to understand. However, over a series of trades, there is usually predictability.
What this article hopefully achieves is urge you to move forward and begin testing chart patterns for yourself, proving if they work for you, noting subtle nuances offered in each trade sample set to work with.


