
Key Highlights
- GBP/USD started a decent increase above the 1.2800 resistance zone.
- A key bullish trend line is forming with support at 1.2720 on the 4-hour chart.
- EUR/USD climbed above the 1.0880 resistance zone.
- Bitcoin failed to recover above the $85,000 resistance zone.
GBP/USD Technical Analysis
The British Pound formed a base and started a fresh increase above 1.2800 against the US Dollar. GBP/USD broke the 1.2850 resistance to enter a positive zone.
Looking at the 4-hour chart, the pair settled above the 1.2850 level, the 100 simple moving average (red, 4-hour), and the 200 simple moving average (green, 4-hour). The pair even cleared the 1.2920 resistance zone.
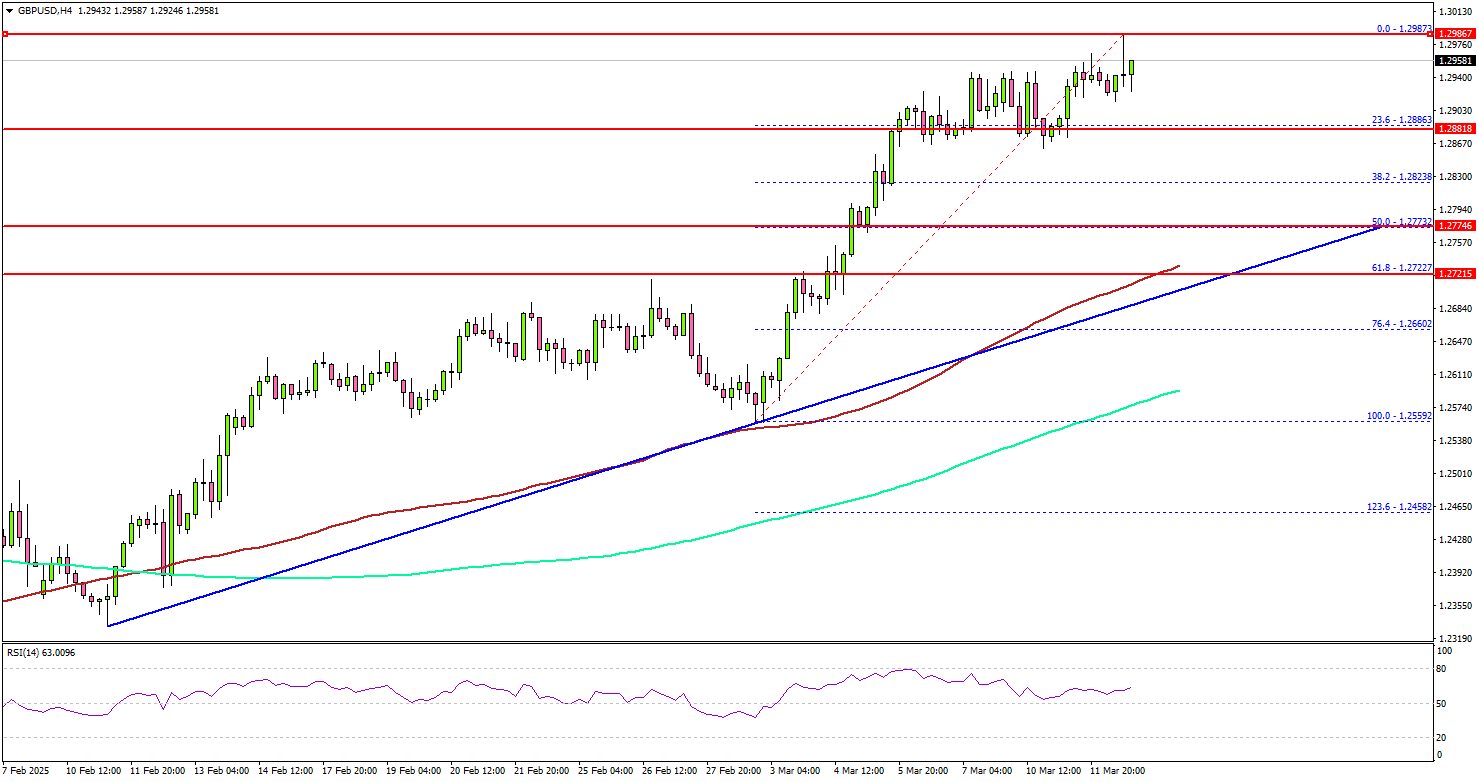
It seems to be aiming for a move above the 1.3000 resistance zone, which is a major hurdle for the bulls. The next major resistance is near the 1.3050 level.
The main resistance is now forming near the 1.3120 zone. A close above the 1.3120 level could set the tone for another increase. In the stated case, the pair could even clear the 1.3200 resistance.
On the downside, immediate support sits near the 1.2880 level. The next key support sits near the 1.2850 level. Any more losses could send the pair toward the 1.2800 level. The main support could be 1.2740. There is also a key bullish trend line forming with support at 1.2720 on the same chart.
Looking at EUR/USD, the pair also started a decent increase and the pair could now aim for a move toward the 1.1000 resistance.
Upcoming Economic Events:
- US Initial Jobless Claims – Forecast 225K, versus 221K previous.
- US Producer Price Index for Feb 2025 (YoY) – Forecast +3.3%, versus +3.5% previous.


