


S&P 500: ⬇️ Sell
– S&P 500 reversed from resistance zone
– Likely to fall to support level 7600.00
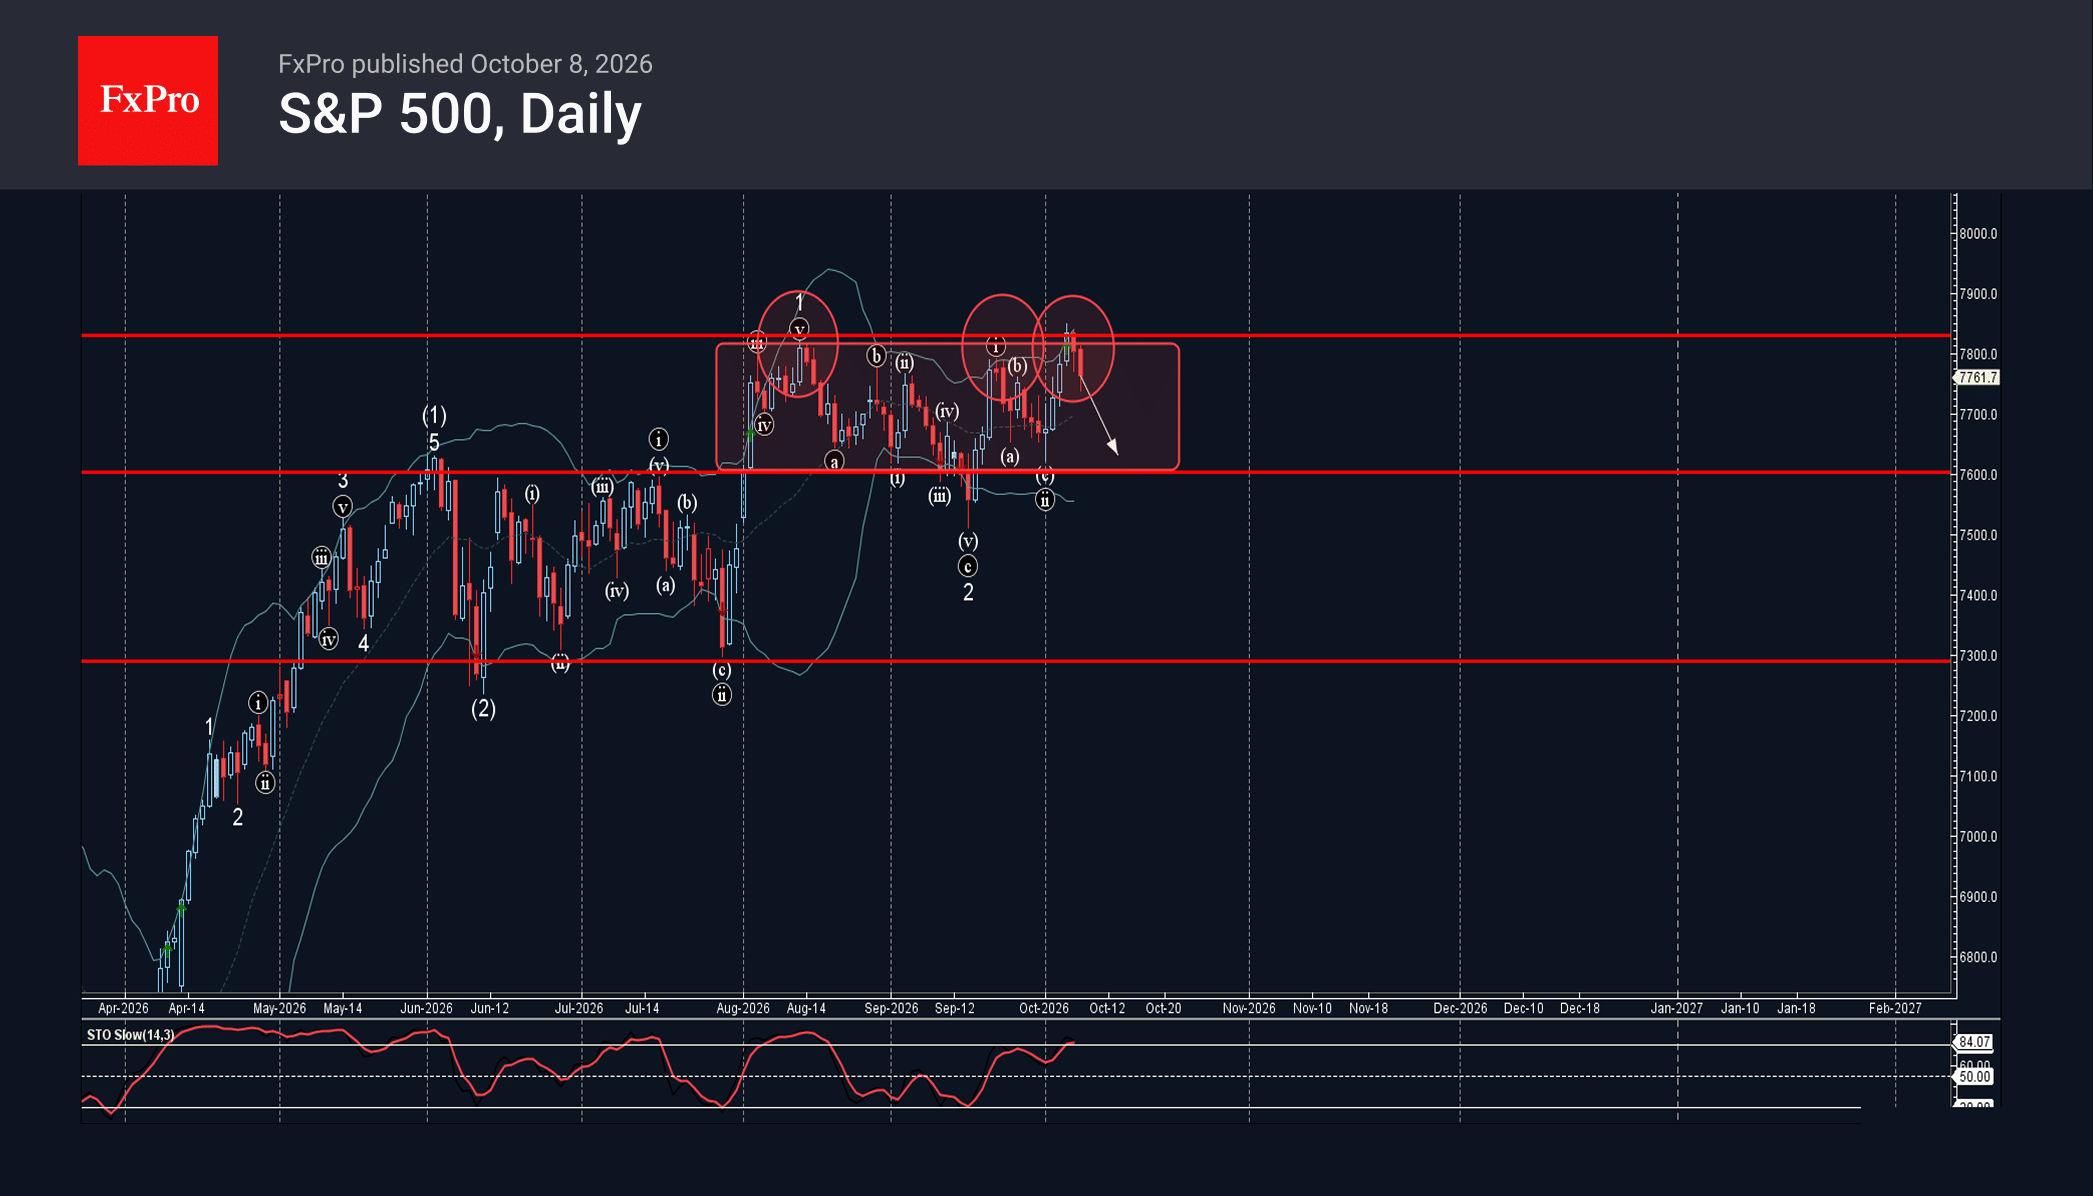
S&P 500 index recently reversed down from the resistance zone between the resistance level 7830.00 (upper border of the sideways price range from the start of August, which stopped wave 1 in the middle of August and wave i at the end of September) and the upper daily Bollinger Band.
The downward reversal from this resistance zone stopped the earlier short-term upward impulse iii from the start of October.
Given the strength of the aforementioned resistance level 7830.00 and the overbought daily Stochastic oscillator, S&P 500 index can be expected to fall further toward the next support level 7600.00 – lower border of the active sideways price range.





 and the upper daily Bollinger Band.)