


Since hitting the record high of $121.64 in January 2026, Silver (XAGUSD) has been in a sustained correction. The decline has developed into a double three Elliott Wave structure, which suggests a long‑term downside target near $38. This level represents the 100% extension of the corrective sequence and remains a key risk if bearish momentum continues.
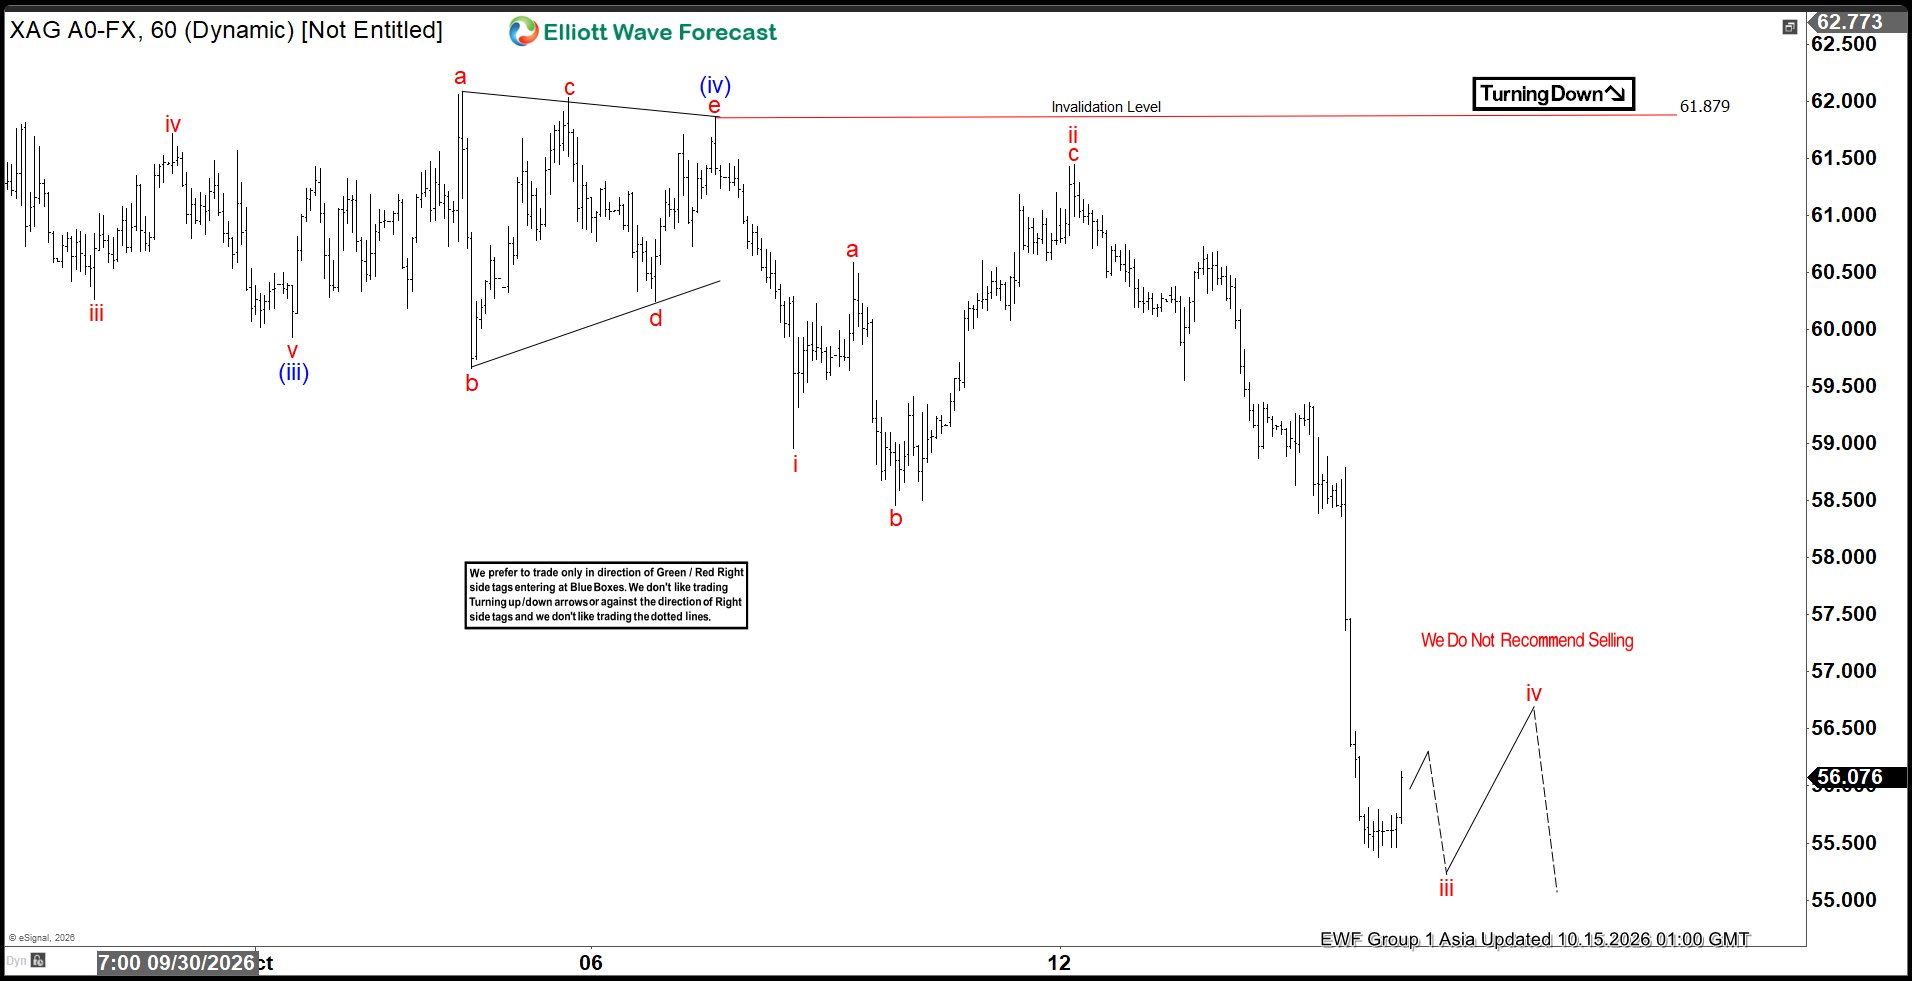
The near‑term cycle from the September 23 high is unfolding as a five‑wave impulse. Wave (i) ended at $63.04, followed by a brief rally in wave (ii) that reached $65.09. The market then dropped in wave (iii) to $59.93, before a pullback in wave (iv) that terminated at $61.80. Price has since resumed lower in wave (v), confirming the continuation of the bearish sequence.
Within wave (v), wave i ended at $58.96, while wave ii retraced to $61.45. The current decline is wave iii, which should complete soon. A corrective bounce in wave (iv) is expected afterward, before another leg lower finalizes wave (v) and completes the cycle from September 23.
As long as the pivot at $61.87 remains intact, rallies should fail in either three or seven swings. This reinforces the downside bias and keeps the $38 target in view. The Elliott Wave framework highlights both the immediate bearish path and the broader risk of deeper losses.
Silver 60 Minute Elliott Wave Chart
 XAGUSD Elliott Wave Video
You are currently viewing a placeholder content from Default. To access the actual content, click the button below. Please note that doing so will share data with third-party providers.





 has been in a sustained correction. The decline has developed into a double...)