


The EU’s goods trade deficit widened sharply from €7.5B in August 2025 to €25.2B in August 2026, as imports grew substantially faster than exports. Extra-EU imports surged 18.2% yoy to €228.0B, outpacing the 9.4% increase in exports to €202.9B. The deterioration was also evident in the Eurozone, where the trade deficit expanded from €1.7B to €16.1B, with imports rising 16.7% against export growth of 9.9%. The weakness extended beyond a single month. During January–August, the EU shifted from a €76.4B surplus last year to a €46.1B deficit, while the Eurozone moved from a €90.9B surplus to a €5.4B deficit. Seasonally adjusted figures also confirmed a monthly deterioration, with the EU deficit widening from €5.4B in July to €12.6B in August.
China accounted for a substantial share of the EU’s worsening trade position, with the bilateral deficit widening from €30.1B to €38.4B. EU imports from China increased 19.7% yoy to €53.1B, while exports rose just 3.2% to €14.7B. The resulting €8.3B deterioration accounted for approximately 47% of the overall EU trade deficit’s annual widening. In contrast, the EU’s trade surpluses with the US and UK expanded, highlighting sharply divergent trading relationships. The surplus with the US increased from €6.3B to €8.6B, supported by 18.5% export growth, while the surplus with the UK widened from €13.1B to €15.0B as exports rose 12.1%. Meanwhile, the deficit with Norway doubled from €2.3B to €4.7B, reflecting a 38.6% increase in imports. The contrasting bilateral performances show that the deterioration was concentrated in particular trading relationships rather than uniform across major partners.
The product breakdown revealed two dominant sources of weakness: machinery and vehicles, and energy. The EU’s machinery and vehicles trade balance swung from a €7.3B surplus to a €2.5B deficit, representing a €9.8B deterioration as imports surged 23.8% yoy against export growth of just 7.7%. Meanwhile, the energy trade deficit widened from €24.3B to €31.4B, adding another €7.1B to the imbalance. Together, these categories accounted for approximately 95% of the overall annual deterioration. The broader manufactured goods surplus consequently narrowed from €14.6B to just €3.1B, although the food and drink surplus improved from €2.9B to €4.2B. August’s figures therefore highlight a trade position increasingly pressured by machinery and vehicle imports and a widening energy imbalance, alongside pronounced differences in the EU’s trading relationships with China, the US and the UK.
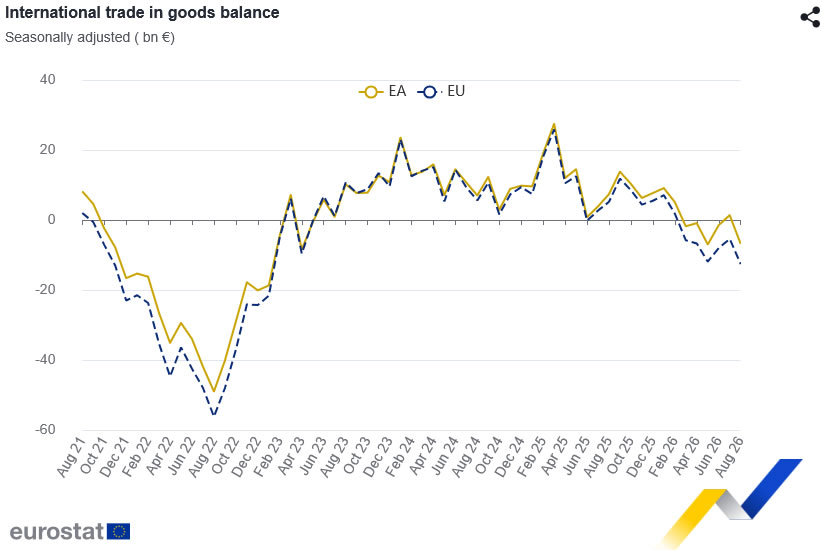
Data Summary — EU and Eurozone Aug 2026 Trade Balance
Headline Trade Data
| Indicator | Aug 2025 | Aug 2026 |
|---|---|---|
| EU trade balance | -€7.5B | -€25.2B |
| EU exports | €185.4B | €202.9B |
| EU imports | €192.9B | €228.0B |
| Eurozone trade balance | -€1.7B | -€16.1B |
| Eurozone exports | €207.2B | €227.7B |
| Eurozone imports | €208.9B | €243.8B |
Annual trade growth:
- EU exports: +9.4% yoy
- EU imports: +18.2% yoy
- Eurozone exports: +9.9% yoy
- Eurozone imports: +16.7% yoy
January–Aug Trade Balance
| Region | Jan–Aug 2025 | Jan–Aug 2026 |
|---|---|---|
| European Union | +€76.4B | -€46.1B |
| Eurozone | +€90.9B | -€5.4B |
Both regions shifted from trade surpluses to deficits over the first eight months of the year.
Seasonally Adjusted Trade Balance
| Region | Jul | Aug |
|---|---|---|
| European Union | -€5.4B | -€12.6B |
| Eurozone | +€1.4B | -€6.8B |
Source: Eurostat, Aug 2026 international trade in goods, released October 16.
EU Trade Balance by Major Trading Partner
| Trading Partner | Aug 2025 | Aug 2026 |
|---|---|---|
| China | -€30.1B | -€38.4B |
| United States | +€6.3B | +€8.6B |
| United Kingdom | +€13.1B | +€15.0B |
| Norway | -€2.3B | -€4.7B |
| Switzerland | +€5.1B | +€5.3B |
| South Korea | -€2.0B | -€2.5B |
| India | -€1.6B | -€1.9B |
China accounted for approximately 47% of the EU’s overall trade balance deterioration, with its bilateral deficit widening by €8.3B.
EU Trade Balance by Product Group
| Product Group | Aug 2025 | Aug 2026 |
|---|---|---|
| Machinery and vehicles | +€7.3B | -€2.5B |
| Energy | -€24.3B | -€31.4B |
| Manufactured goods, total | +€14.6B | +€3.1B |
| Chemicals | +€15.1B | +€14.1B |
| Food and drink | +€2.9B | +€4.2B |
| Other manufactured goods | -€7.8B | -€8.4B |
Machinery and vehicles, together with energy, accounted for approximately 95% of the EU’s annual trade balance deterioration.
Source: Eurostat, EU trading partners and product breakdown.
Key Takeaways
- EU trade deficit widens sharply: The EU’s goods trade deficit increased from €7.5B to €25.2B in Aug compared with a year earlier, as imports surged 18.2% yoy against export growth of 9.4%. The Eurozone deficit also widened from €1.7B to €16.1B.
- China drives a substantial share of the deterioration: The EU’s trade deficit with China expanded from €30.1B to €38.4B, as imports increased 19.7% yoy while exports rose just 3.2%. The €8.3B widening accounted for approximately 47% of the overall EU deterioration.
- US and UK surpluses expand despite the overall deficit: The EU’s trade surplus with the US increased from €6.3B to €8.6B, while its surplus with the UK widened from €13.1B to €15.0B. The contrasting performances highlight uneven trading relationships.
- Machinery and energy account for most of the weakness: Machinery and vehicles swung from a €7.3B surplus to a €2.5B deficit, while the energy deficit widened from €24.3B to €31.4B. Together, these categories explained approximately 95% of the annual deterioration.
- Trade deterioration extends beyond Aug: During January–Aug, the EU shifted from a €76.4B surplus last year to a €46.1B deficit. Seasonally adjusted figures also showed the monthly deficit widening from €5.4B in July to €12.6B in Aug.





