
The laws governing the creation of fractals are found throughout nature. Fractal patterns are recursive as no matter how complex the whole, it’s built from many repetitions of the same process. Romanesco broccoli, spirals of pinecone seeds, ice crystals, trees, rivers, leaves and even water drops exhibit the properties of repeated application.
The late Benoit Mandelbrot, a Polish-born, French and American mathematician, was largely responsible for developing the study of fractal geometry, and considered by many as the father of fractals.
Although price movement can appear random – an ongoing debate among academics – repeating patterns and trends appear visible in the financial markets, across all asset classes. One of the most basic repeating patterns is a fractal.
What is a fractal pattern?
Fractal patterns provide a way of estimating probable reversal points on charts.
A core fractal pattern comprises of five candlesticks (or bars).
As illustrated in figure 1.1, an initiating fractal must contain a middle candle, a higher high or lower low, with two lower highs/higher lows either side. Note other less perfect patterns can occur, whereby the pattern forms an irregular V shape, though basic structure should remain intact.
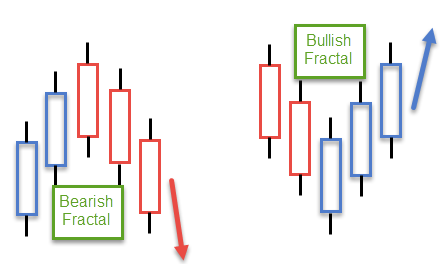
(FIGURE 1.1)
Several trading strategies exist based on fractals, each with specific rules of engagement. For example, some traders favour fractals as a means of confirmation, such as at areas of support or resistance, supply or demand and trend lines.
It is also worth noting fractals are lagging indicators. A fractal can’t be drawn until two days into the reversal. Since most significant reversals extend far beyond the trigger point (two candles), however, the move typically offers favourable risk/reward conditions in the right location.
Figure 1.2 displays two examples of bearish fractal patterns in action. Both formations housed minimal drawdown and favourable risk/reward.
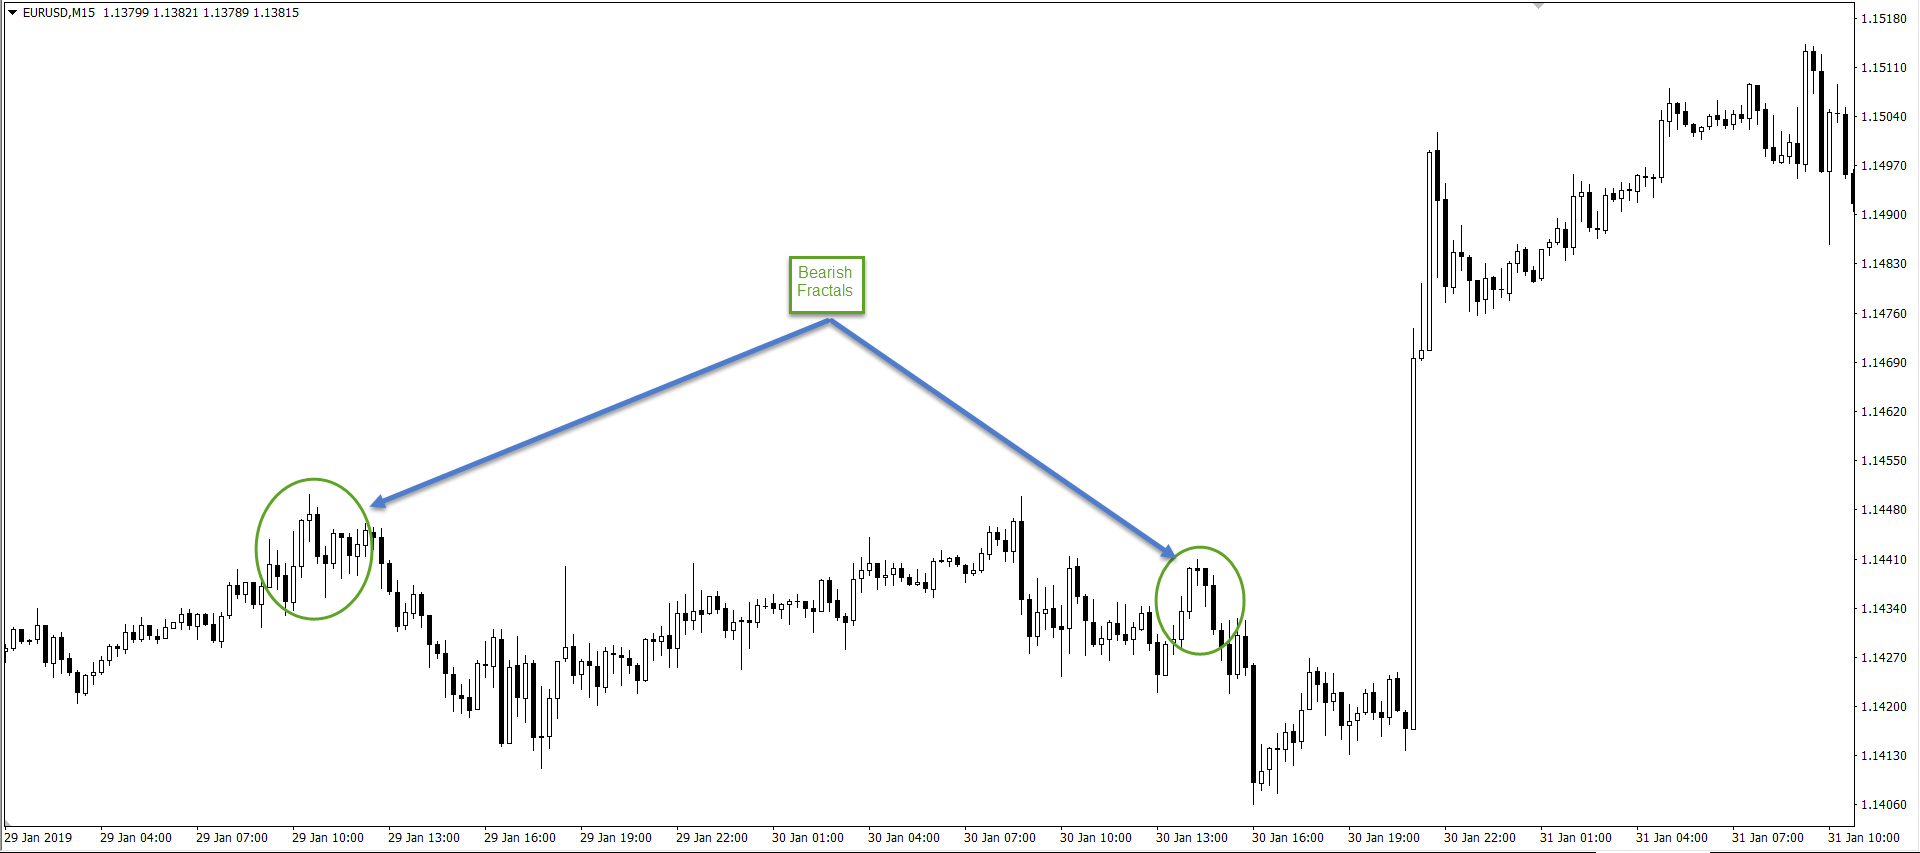
(FIGURE 1.2)
Most trading platforms offer fractals in the form of a trading indicator. The application highlights fractal patterns formed in the market, saving the trader valuable time.
Traders can find the fractals indicator within the Bill Williams folder in MT4’s Navigator tab (see figure 1.3). Bill Williams is an American trader and author of books on trading psychology, technical analysis and chaos theory.
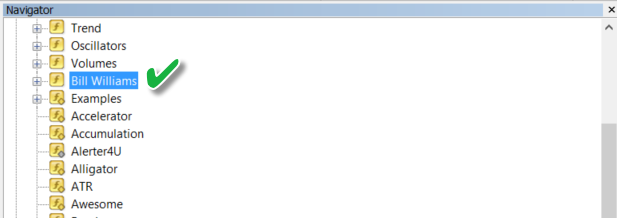
(FIGURE 1.3)
Following this, you’re presented with a set of sub-folders – select the fractals indicator (figure 1.4).
Many traders use Bill William’s indicator in alliance with other Bill William’s indicators. One of the most popular indicator combinations is the Alligator indicator (or William’s Alligator).
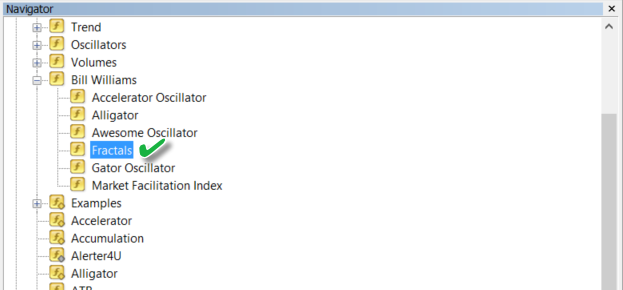
(FIGURE 1.4)
Another dialogue box will appear following the Fractals selection, offering traders the opportunity to customise the indicator’s colour and visualisation (figure 1.5).
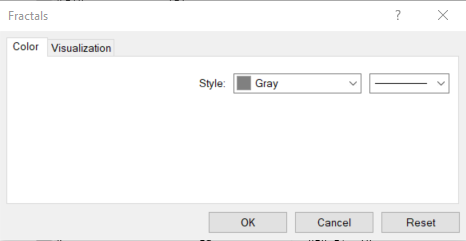
(FIGURE 1.5)
As visible from the H1 chart depicted in figure 1.6, the first thing observed is the frequency of signals, possibly overwhelming newer traders. A bearish fractal (a down fractal) forms an upward facing arrow, whereas bullish fractals (an up fractal) generate downward facing arrows.
Switching things up to the higher timeframes tends to reduce the number of signals.
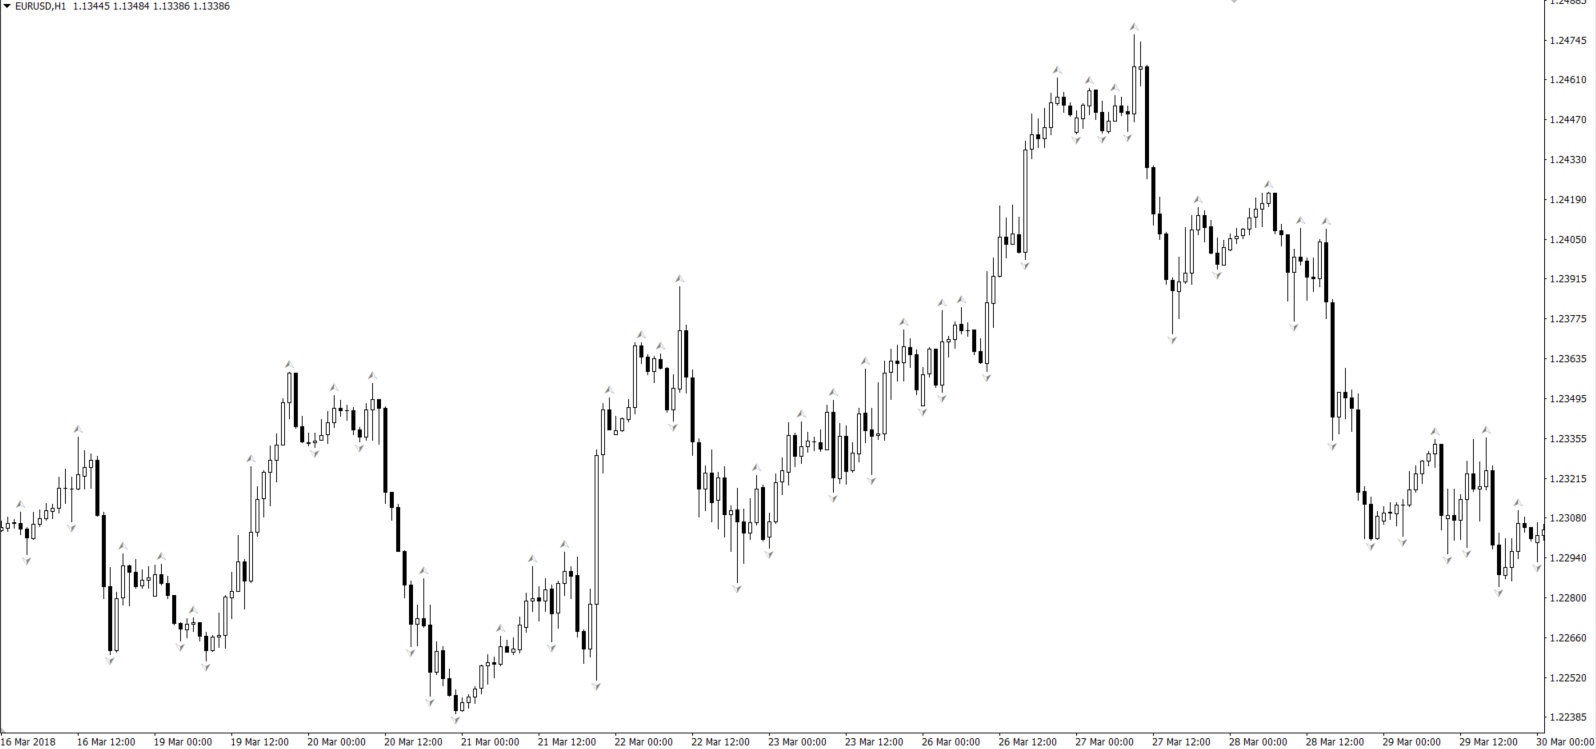
(FIGURE 1.6)
Another method of filtering fractal signals is by syncing additional technical indicators. A common indicator used for confirmation is the Alligator indicator. Also developed by Bill Williams, the Alligator indicator uses three smoothed moving averages, set at five, eight and thirteen periods. The initial smoothed average computes using a simple moving average (SMA), adding additional smoothed averages that slow down indicator turns.
Figure 1.7 offers several confirming signals as price action bounces off the middle moving average alongside a fractal signal (green check marks). Unfortunately, it’s beyond the scope of this article to delve much deeper into the benefits of applying this indicator, though this should serve as an introduction.
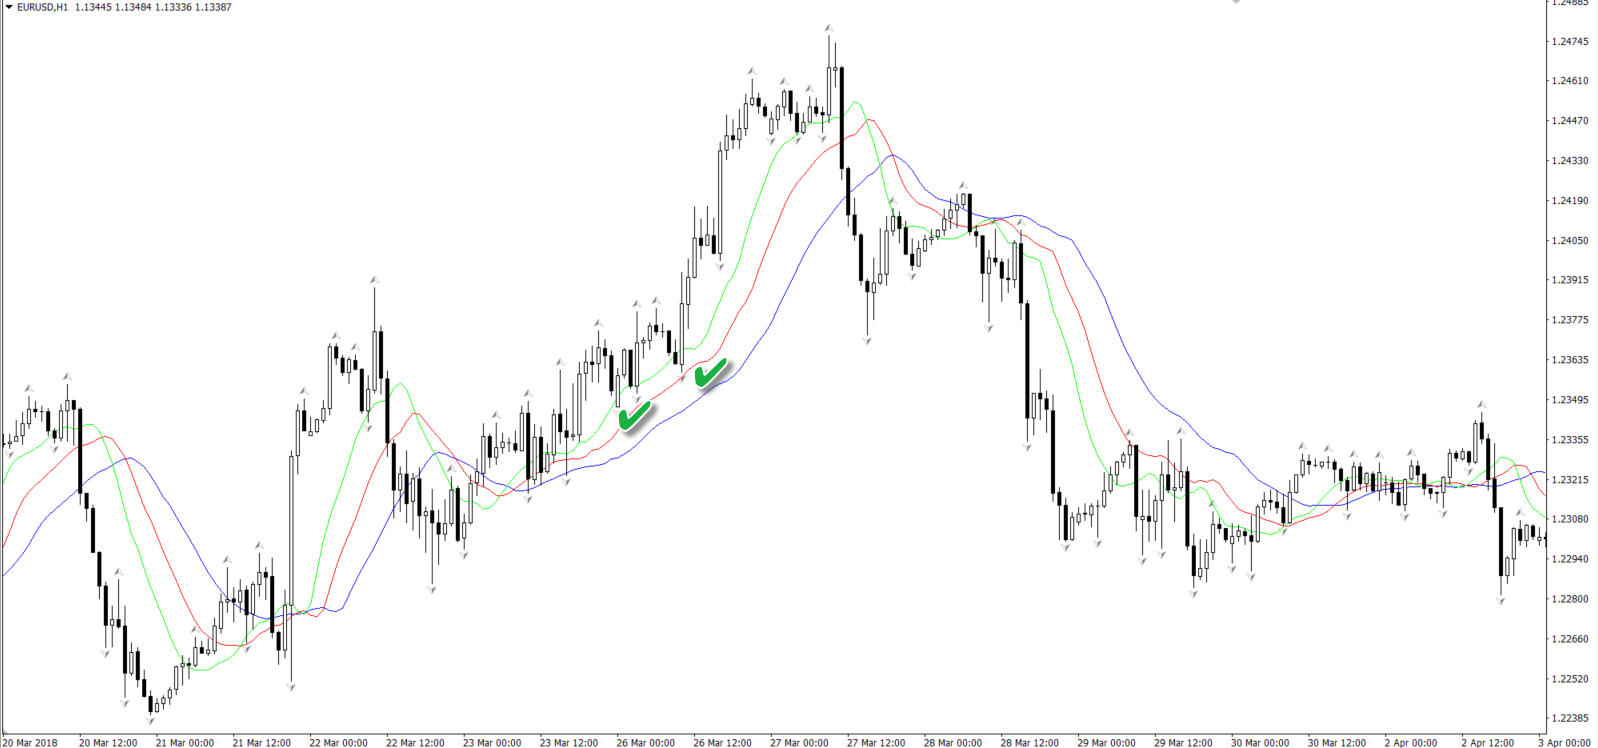
(FIGURE 1.7)
Instead of applying additional indicators, traders may choose to learn how to identify a trending market. A market that’s trending higher displays higher highs and higher lows. A market trending lower, on the other hand, generates lower lows and lower highs.
Using price action
While a plethora of price-based techniques are available, the following two approaches are ideal for beginner traders.
Traders can apply support and resistance levels and use the fractal indicator as a means of confirming entry.
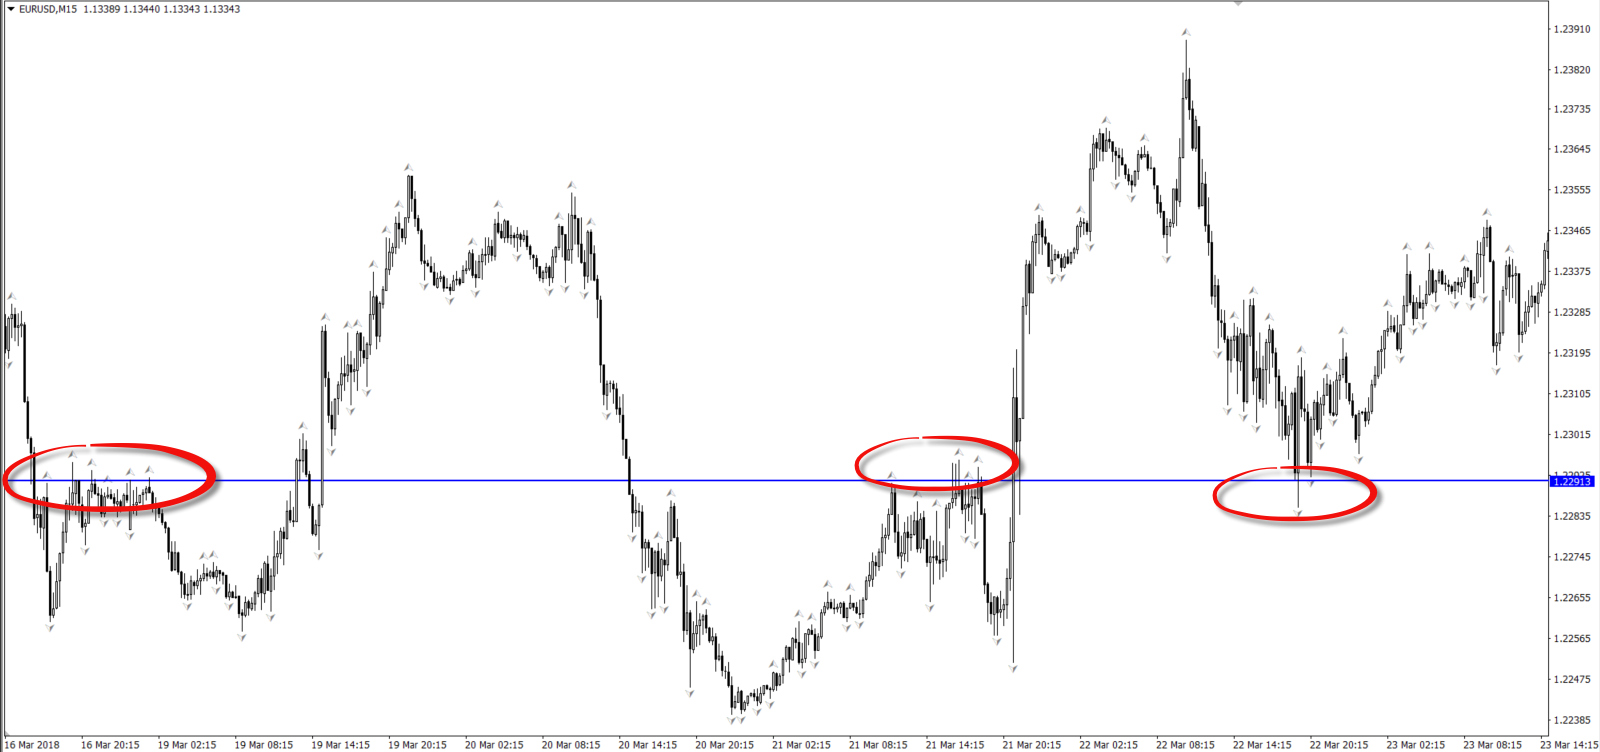
(FIGURE 1.8)
Figure 1.8 shows merging support and resistance alongside fractal signals. Like all technically-based methods, however, losses WILL occur. Nevertheless, after learning how to accurately select support and resistance levels, executing fractal signals off these barriers certainly places the odds in your favour.
Another popular approach (see figure 1.9) is the use of Fibonacci studies. Combining these values with fractal signals (and in this case, strict support and resistance) adds considerable weight to a trade moving favourably.
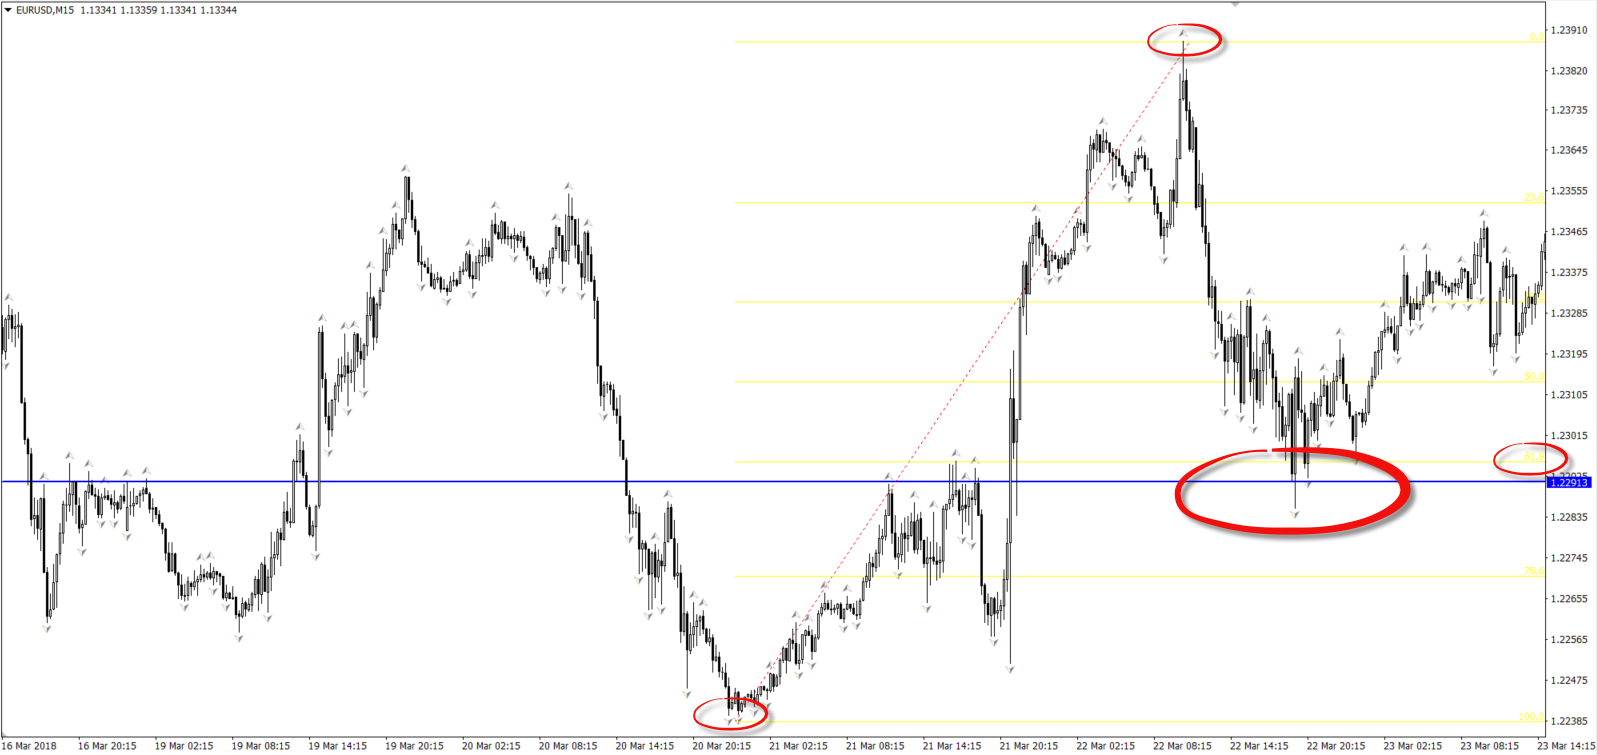
(FIGURE 1.9)
A common, yet conservative, technique used to enter off the back of a fractal signal is trade the break of the second candle high (as in the case of a bullish signal) and place protective stop-loss orders beneath the pattern’s low, as shown in figure 1.10. It’s the same for a bearish fractal pattern, only inverse.
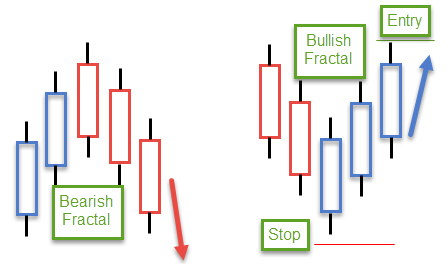
(FIGURE 1.10)
Takeaway points:
- Traders have the choice of either applying an indicator to identify fractals or learning to recognize them manually.
- Fractals are lagging, though serve as an impressive technical tool to confirm levels of interest.
- The longer the time period, the more dependable the signal is said to be.
- Fractals are best used in trending environments. Avoid executing trades in ranging markets unless the range offers satisfactory risk/reward.
- Fractals are used in many ways. Traders must find their own methodology that suits their personality and trading style.


