


US economic growth accelerated from 2.2% to 3.4% annualized in Q3, exceeding market expectations of 3.2%, according to the Bureau of Economic Analysis’ advance estimate. The stronger expansion was driven by increases in private investment, consumer spending and government spending, partly offset by weaker exports and higher imports. Compared with Q2, the acceleration primarily reflected stronger investment and an upturn in government spending, while trade provided a larger drag. The report highlighted continued resilience in domestic economic activity, despite the negative contribution from net exports.
Investment was a major driver of the acceleration, led by increases in private inventories and equipment spending. Inventory accumulation was concentrated in wholesale trade and manufacturing, particularly nondurable goods industries. Meanwhile, equipment investment was led by information-processing equipment, mainly computers and peripheral equipment. The strength was consistent with September’s advance trade report, which showed capital goods imports jumping 7.5%, or approximately $10.9B. However, the increase in imported capital goods also contributed to the negative trade balance, illustrating how stronger investment demand can coincide with a drag from net exports. The BEA identified petroleum and related products as the main source of declining exports, while capital goods led the increase in imports.
Consumer spending also continued expanding across goods and services. Services growth was led by health care, particularly hospitals and outpatient services, alongside restaurants and accommodations. Among goods, prescription drugs were an important contributor. More significantly, real final sales to private domestic purchasers accelerated from 4.6% to 4.9% annualized, indicating that underlying private demand remained strong even excluding inventories, net exports and government spending. The improvement suggests that Q3’s robust expansion was not solely dependent on inventory accumulation, with household consumption and private fixed investment providing substantial support.
The stronger growth performance was accompanied by a moderation in quarterly inflation. The annualized PCE price index slowed from 5.0% to 2.1%, while core PCE inflation eased from 3.3% to 2.5%. The gross domestic purchases price index also moderated from 5.6% to 3.0%. Together, the figures suggest that resilient economic activity coincided with slower quarterly price increases, although they do not establish that inflation pressures have been fully contained. The separately released September PCE figures will provide a more detailed assessment of price developments at the end of the quarter. Overall, the GDP report points to strong underlying domestic demand alongside easing quarterly inflation, offering a more balanced economic picture than the headline growth surprise alone.
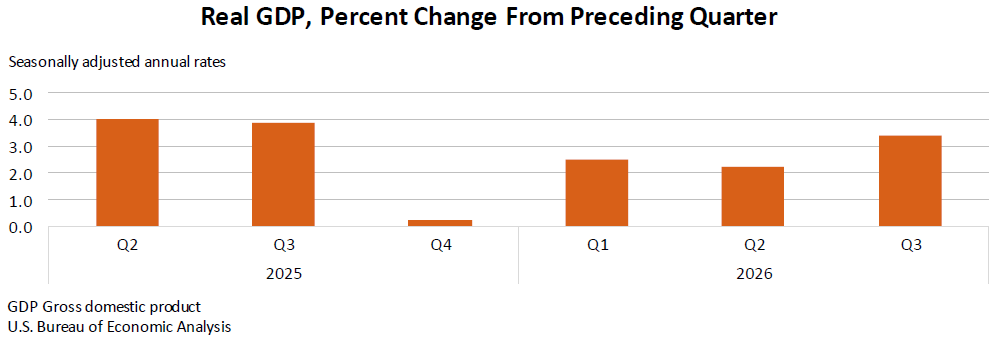
Data Summary
US GDP — Q3 2026 Advance Estimate
| Indicator | Q2 | Q3 |
|---|---|---|
| Real GDP Growth (Annualized) | 2.2% | 3.4% |
| Real Final Sales to Private Domestic Purchasers | 4.6% | 4.9% |
| Current-Dollar GDP Growth (Annualized) | — | 5.6% |
| Gross Domestic Purchases Price Index | 5.6% | 3.0% |
| PCE Price Index (Annualized) | 5.0% | 2.1% |
| Core PCE Price Index (Annualized) | 3.3% | 2.5% |
Headline consensus: 3.2%, compared with actual GDP growth of 3.4%, representing a 0.2 percentage-point upside surprise.
Main Contributors to Growth
| Component | Q3 Development |
|---|---|
| Private Investment | Increased, led by inventories and equipment |
| Consumer Spending | Increased across goods and services |
| Government Spending | Increased, partly reflecting federal nondefense spending |
| Exports | Decreased, led by petroleum and related products |
| Imports | Increased, led by capital goods, excluding automotive |
Notable investment detail: Information-processing equipment, particularly computers and peripheral equipment, led the increase in equipment investment.
Source: US Bureau of Economic Analysis, GDP Advance Estimate, Q3 2026, released October 29, 2026. Growth and quarterly inflation figures are seasonally adjusted annualized rates.
Key Takeaways
- US GDP growth accelerates above expectations: Real GDP increased from 2.2% to 3.4% annualized in Q3, exceeding the 3.2% consensus. Investment, consumer spending and government spending supported expansion, while trade detracted.
- Investment drives much of the acceleration: Stronger private inventory accumulation and equipment investment were key contributors. Inventories increased in wholesale trade and manufacturing, while information-processing equipment led capital spending growth.
- Private domestic demand remains resilient: Real final sales to private domestic purchasers accelerated from 4.6% to 4.9%, indicating that underlying household consumption and private fixed investment remained strong beyond inventory accumulation.
- Consumer spending expands across goods and services: Health care, restaurants and accommodations supported services spending, while prescription drugs contributed to goods consumption.
- Trade provides a significant offset: Exports declined, particularly petroleum and related products, while imports increased, led by capital goods. The pattern is consistent with September’s sharp increase in capital goods imports.
- Investment and import growth occur together: Strong demand for imported equipment supports business capital expenditure but also contributes to the negative net export component of GDP. The increase should not be interpreted as purely domestic production growth.
- Quarterly inflation moderates despite stronger growth: Annualized headline PCE inflation slowed from 5.0% to 2.1%, while core PCE eased from 3.3% to 2.5%. The gross domestic purchases price index also moderated from 5.6% to 3.0%.
- Growth-inflation picture becomes more balanced: The economy maintained strong domestic momentum while quarterly price increases slowed. However, the advance estimate does not establish that inflation persistence has been resolved, and September’s separate PCE figures require independent assessment.