


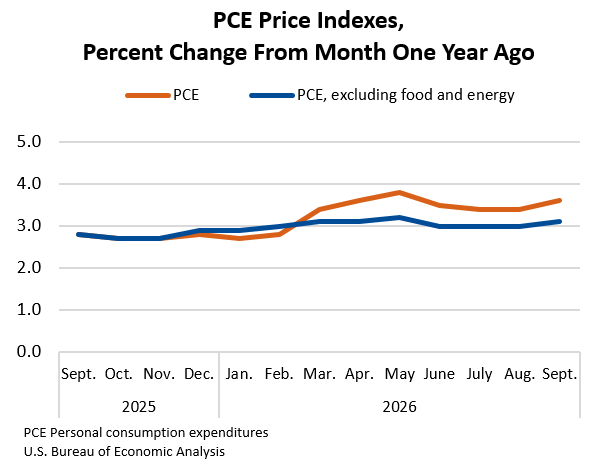
US headline PCE inflation accelerated from 3.4% to 3.6% y/y in September, matching market expectations, while monthly inflation increased from 0.3% to 0.5%. Core PCE inflation also edged higher from 3.0% to 3.1% y/y, in line with consensus, although the monthly rate held steady at 0.3%. The figures indicate that headline price pressures intensified while underlying inflation remained persistently elevated, rather than showing a fresh monthly acceleration. The divergence between headline and core measures is consistent with the impact of higher energy prices, which continued to weigh on household purchasing power.
Consumer spending increased 0.5% m/m in nominal terms, slowing from August’s 0.9% gain and falling short of expectations of 0.6%. More significantly, inflation-adjusted consumer spending was virtually unchanged, following a 0.5% increase in August, indicating that higher prices absorbed much of the nominal expenditure growth. Total spending rose $113.1B, comprising increases of $35.1B in goods and $78.1B in services. Gasoline and other energy goods alone accounted for $45.7B of the increase, exceeding the net rise in total goods spending, while motor vehicle expenditure declined $14.0B. The composition highlights the substantial contribution of energy-related spending to the nominal increase, without a corresponding expansion in real consumption.
Household income growth also failed to keep pace with inflation. Personal income increased just 0.2% m/m, down from 0.3% and below expectations of 0.3%, while disposable personal income similarly rose 0.2%. After adjusting for inflation, real disposable income declined 0.3%, following no growth in August. The increase in nominal income primarily reflected higher compensation and government social benefits, but these gains were insufficient to offset rising consumer prices. Meanwhile, the personal saving rate stood at 3.8%. The combination of weaker income growth and declining real purchasing power suggests that households faced greater financial pressure at the end of Q3, potentially constraining their capacity to sustain discretionary spending growth.
The September figures provide an important qualification to today’s stronger-than-expected Q3 GDP report, which showed annualized growth accelerating from 2.2% to 3.4%, supported by resilient consumer spending and investment. While real final sales to private domestic purchasers strengthened from 4.6% to 4.9% over the quarter, September’s stagnation in real consumption suggests that household spending momentum weakened toward quarter-end. The two reports are not contradictory, as strong activity earlier in the quarter can coexist with slower monthly growth in September. Nevertheless, the combination of elevated inflation, declining real disposable income and flat real spending raises questions about whether the recent strength in consumption can be sustained. The data point to emerging pressure on household purchasing power, rather than definitive evidence of a broader consumer slowdown.
Data Summary
US Personal Income and Outlays — September 2026
| Indicator | Aug | Sep | Cons. |
|---|---|---|---|
| PCE Price Index m/m | 0.3% | 0.5% | 0.5% |
| PCE Price Index y/y | 3.4% | 3.6% | 3.6% |
| Core PCE Price Index m/m | 0.3% | 0.3% | 0.3% |
| Core PCE Price Index y/y | 3.0% | 3.1% | 3.1% |
| Personal Income m/m | 0.3% | 0.2% | 0.3% |
| Disposable Personal Income m/m | 0.3% | 0.2% | — |
| Real Disposable Income m/m | 0.0% | -0.3% | — |
| Nominal Consumer Spending m/m | 0.9% | 0.5% | 0.6% |
| Real Consumer Spending m/m | 0.5% | 0.0% | — |
| Personal Saving Rate | — | 3.8% | — |
Real consumer spending increased by less than 0.1% in September, rounded to 0.0% in the BEA table.
Consumer Spending Composition — September
| Component | Change |
|---|---|
| Total Nominal Consumer Spending | +$113.1B |
| Goods Spending | +$35.1B |
| Services Spending | +$78.1B |
| Gasoline and Other Energy Goods | +$45.7B |
| Transportation Services | +$18.4B |
| Housing and Utilities | +$17.8B |
| Food Services and Accommodations | +$15.5B |
| Health Care | +$13.0B |
| Motor Vehicles and Parts | -$14.0B |
Spending changes are expressed at seasonally adjusted annual rates.
Personal Income: Increased $54.5B in September, while disposable personal income rose $52.7B.
Personal Saving: $911.1B at an annualized rate, equivalent to a saving rate of 3.8%.
Source: US Bureau of Economic Analysis, Personal Income and Outlays, September 2026, released October 29, 2026. Consensus figures from the supplied economic calendar.
Key Takeaways
- Headline PCE inflation accelerates: Annual inflation rose from 3.4% to 3.6% in September, while monthly inflation increased from 0.3% to 0.5%. Both readings matched market expectations.
- Core inflation remains elevated: Core PCE inflation edged up from 3.0% to 3.1% y/y, although its monthly increase held steady at 0.3%, indicating persistent underlying price pressures without a fresh monthly acceleration.
- Consumer spending undershoots expectations: Nominal spending growth slowed from 0.9% to 0.5% m/m, below the 0.6% consensus.
- Real consumer spending stalls: Inflation-adjusted spending slowed from 0.5% to virtually 0.0%, suggesting that higher prices absorbed much of the nominal spending increase.
- Energy expenditure accounts for a large share of spending growth: Gasoline and other energy goods contributed $45.7B to the $113.1B increase in nominal consumption, exceeding the net increase in total goods spending.
- Personal income growth weakens: Nominal income growth eased from 0.3% to 0.2%, missing expectations of 0.3%. Disposable personal income also increased 0.2%.
- Household purchasing power deteriorates: Real disposable income fell 0.3% after remaining unchanged in August, as inflation outpaced nominal income growth.
- Saving rate stands at 3.8%: Personal saving totalled $911.1B at an annualized rate, although the aggregate measure does not reveal differences in financial conditions across households.
- Strong Q3 GDP contrasts with softer September momentum: GDP growth accelerated from 2.2% to 3.4% annualized in Q3, but real spending stagnated in September. The figures suggest that strong quarterly consumption ended with weaker monthly momentum, without yet confirming a sustained slowdown.