

Hello, fellow traders. In this technical blog, we’ll take a closer look at our Elliott Wave charts for the Hang Seng Index, published in the members’ area of our website. We identified the completion of the cycle from the June 26 low and anticipated a deeper pullback against the 22,517 low. In the following analysis, we’ll review the Elliott Wave structure and see how the market followed our outlook.
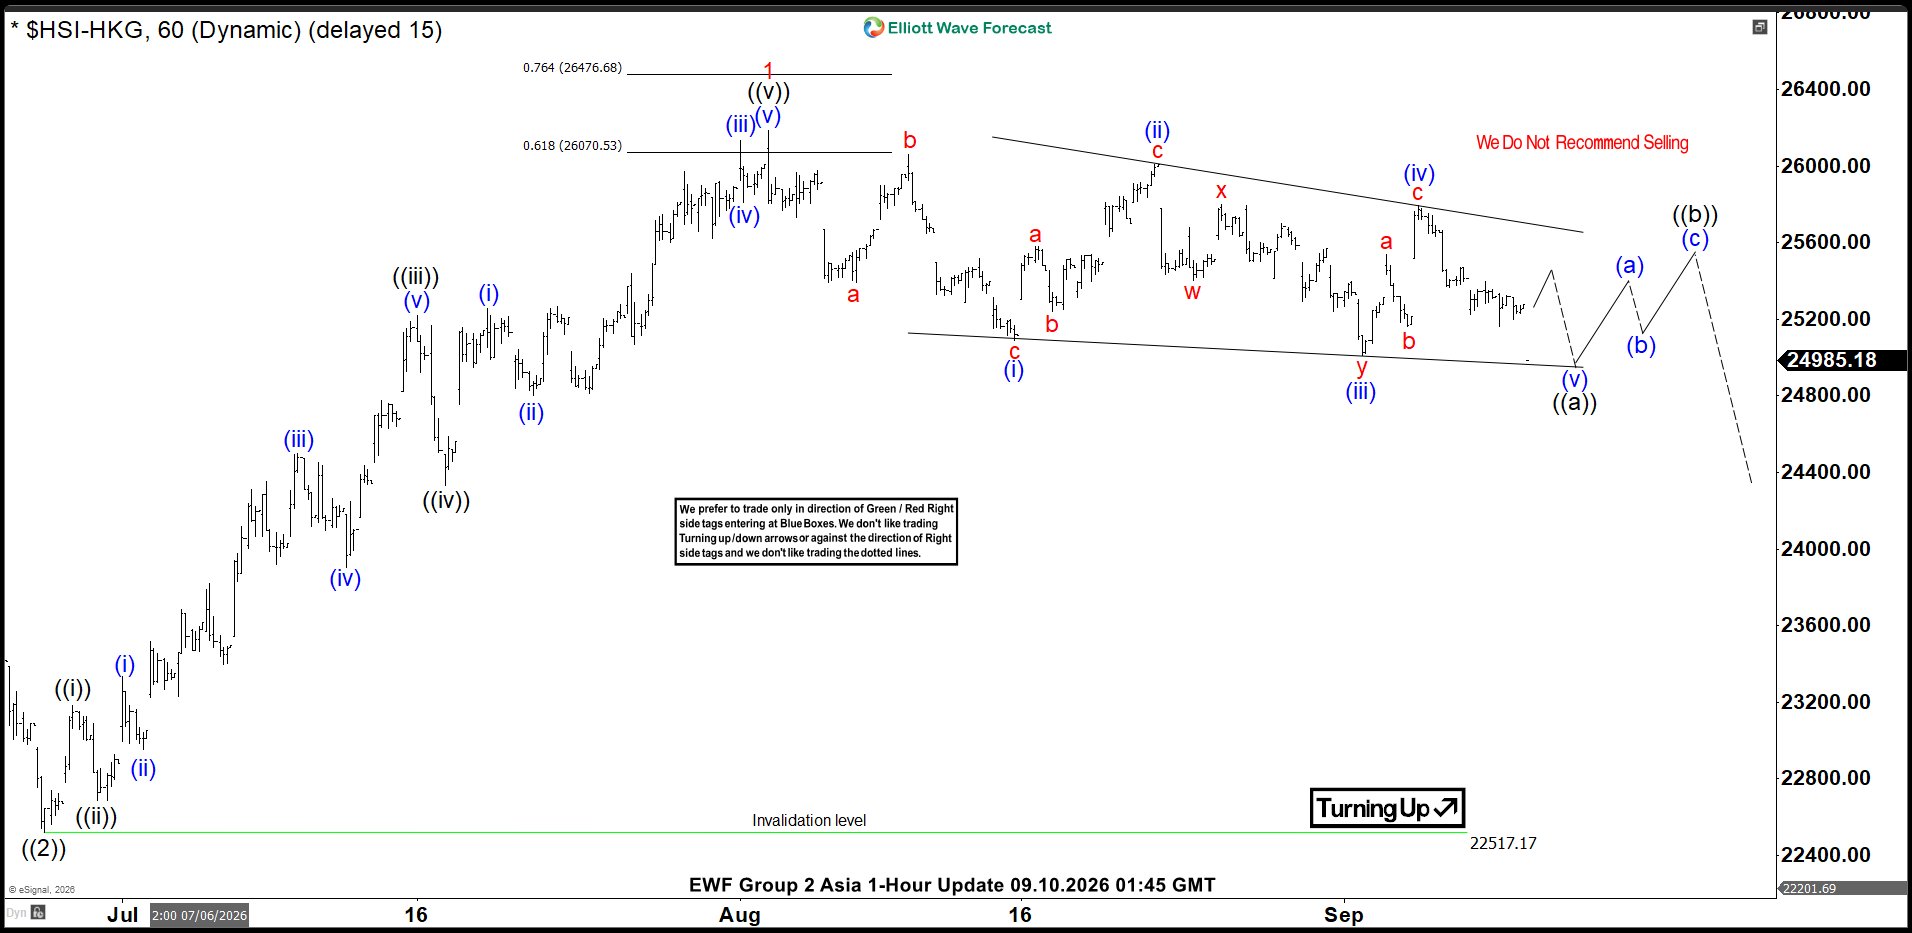
Hang Seng Elliott Wave 1-Hour Chart 09.10.2026
Back then, we considered the cycle from the 22,517 low to have completed at the 26,190 peak. The price structure was relatively sideways at the time, and our analysis suggested that the market was still in the early stages of a deeper correction, with further downside expected. The key level at that stage was the 26,190 peak. As long as the price remained below this high, we expected the deeper correction to continue unfolding, with the potential to eventually retest the 22,517 low.
Reminder: You can learn more about Elliott Wave Patterns at our Free Elliott Wave Educational Web Page
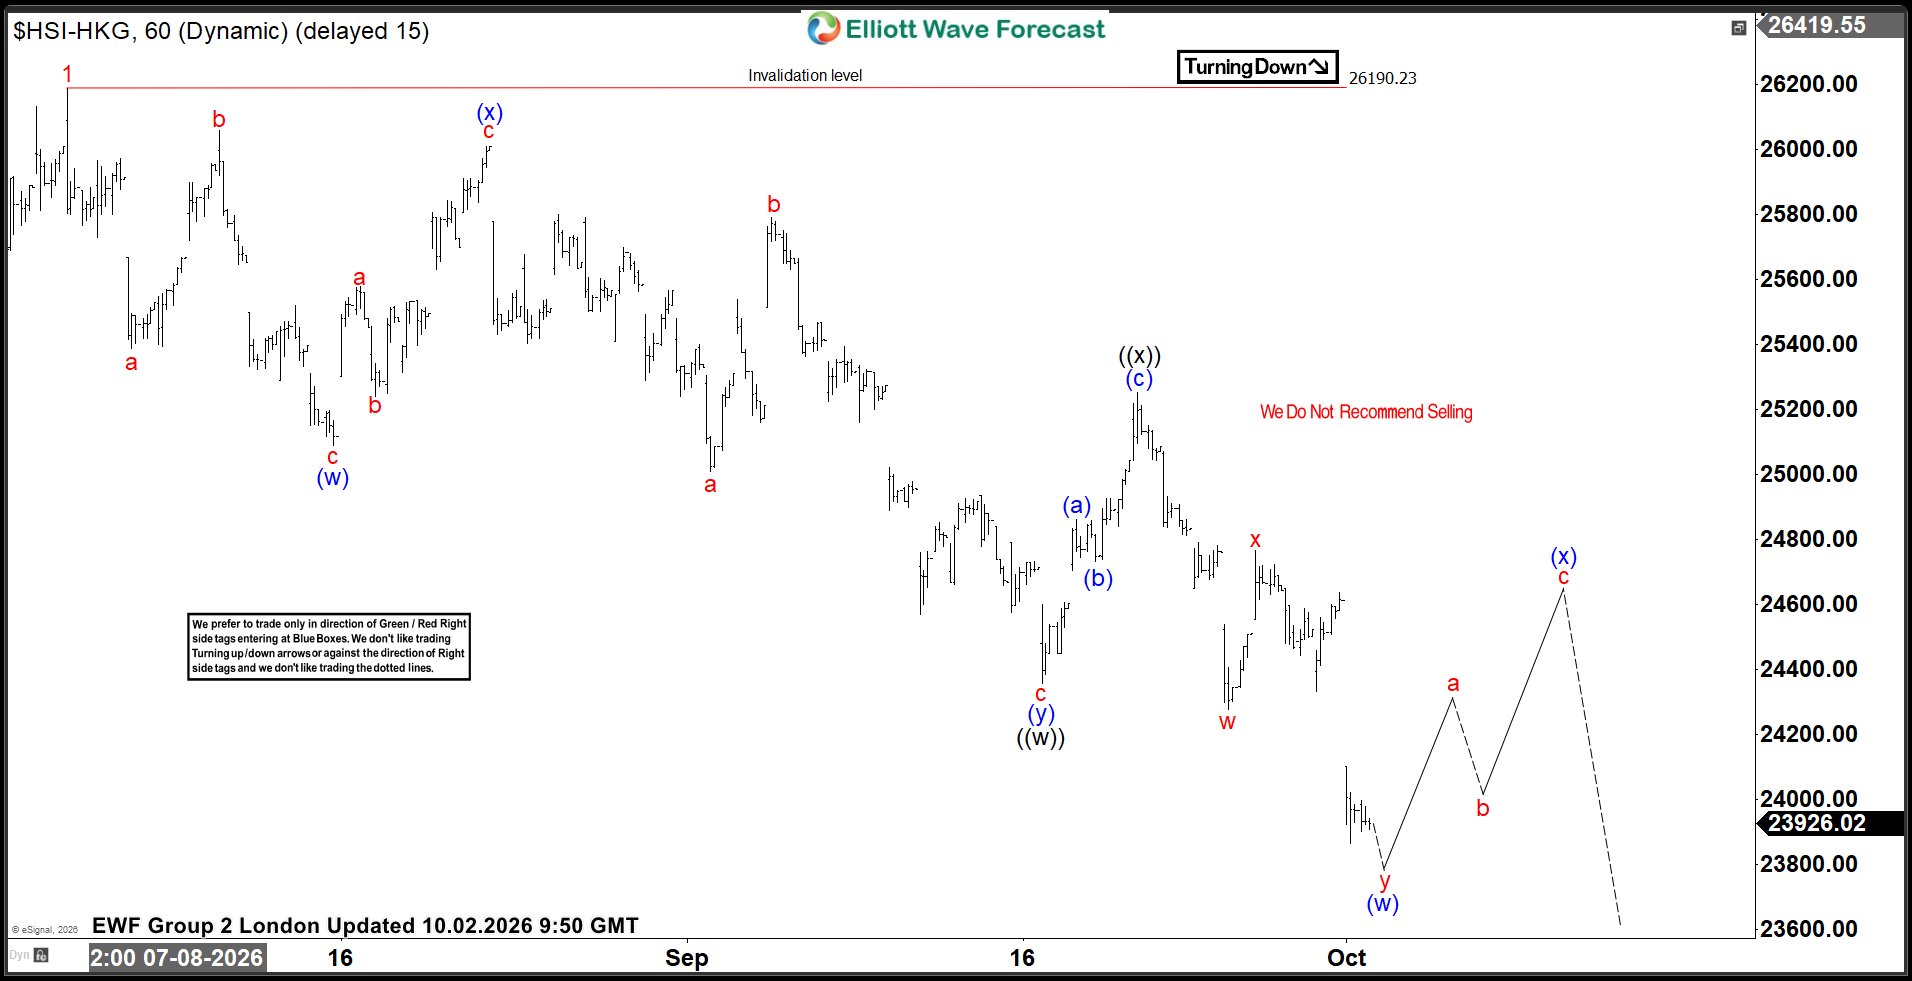
Hang Seng Elliott Wave 1-Hour Chart 10.02.2026
Three weeks later, we can see that the market followed our proposed path , with the index declining as expected. The price structure now looks completely different. We can identify incomplete sequences from the major 26,190 peak. These types of structures help us identify target areas with a high degree of accuracy.
The price action was forming an Elliott Wave Double Three pattern. In such cases, we use the Fibonacci Extension tool, measuring ((w)) relative to ((x)), to identify the target area. While below the ((x)) black high, the index should ideally continue lower toward the 23,419–22,281 area. At that zone, sellers are likely to take profits while buyers step in. Therefore, we expect at least a three-wave bounce from the mentioned area.
In the meantime, we expected to see a three-wave bounce in (x) blue before the decline resumes.
Important note: Keep in mind that the market is dynamic, and the outlook may have changed in the meantime. Our member Chat Rooms are open 24 hours a day, Monday through Friday, on trading days, providing ongoing expert guidance on market trends and Elliott Wave analysis. Members can ask questions about market structure and technical setups at any time during trading days.