


The USDCAD pair continues to show an incomplete bullish sequence from the January 30, 2026 low. This structure supports an eventual move toward the 1.4500 area. The broader trend remains constructive, and price action continues to favor further upside. In the short term, the rally from the August 21, 2026 low is unfolding as a zigzag Elliott Wave structure. Within this pattern, wave A ended at 1.4300. The subsequent pullback in wave B found support at 1.3920. Following that low, the pair resumed higher in wave C. This leg is developing as a five-wave impulse.
The internal structure of wave C remains clearly bullish. From the wave B low, wave (i) advanced to 1.4137. A brief retracement in wave (ii) then ended at 1.4070. Buyers returned afterward and pushed the pair sharply higher in wave (iii). That advance reached the 1.4300 area. A corrective decline in wave (iv) followed and completed at 1.4220. Since then, the pair has turned higher again. This suggests that wave (v) is currently underway.
The final advance in wave (v) should complete wave ((i)) of a higher degree. Once that rally ends, a pullback in wave ((ii)) is expected. This correction should retrace the cycle that began from the November 4, 2026 low. However, the decline should remain corrective. The larger bullish sequence is expected to stay intact. After wave ((ii)) finishes, the broader uptrend should resume.
Near-term expectations remain positive while the 1.3920 pivot holds. Any pullback should attract buyers in a corrective 3, 7, or 11-swing structure. Such setbacks are expected to provide support for another advance. Therefore, the bullish outlook remains favored. The pair should continue higher and maintain its path toward the 1.4500 target.
USDCAD 60 Minute Elliott Wave Chart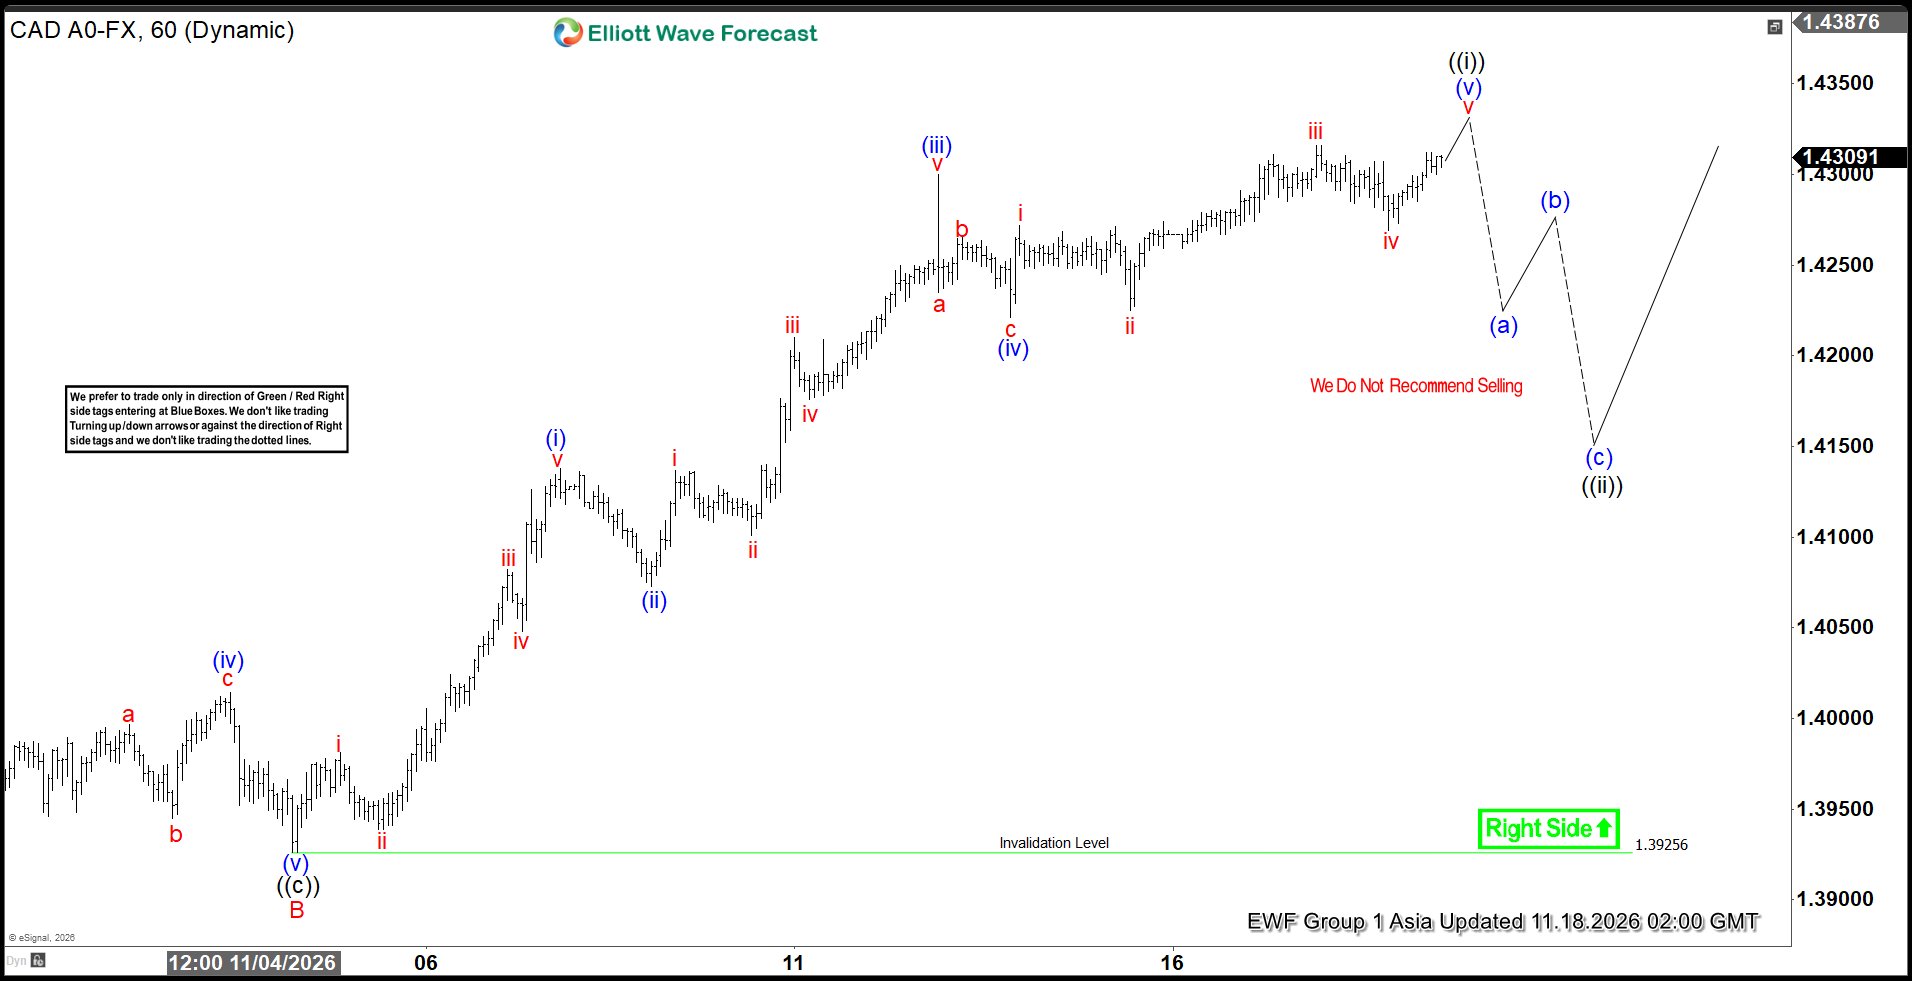
USDCAD Elliott Wave Video
You are currently viewing a placeholder content from Default. To access the actual content, click the button below. Please note that doing so will share data with third-party providers.