
A note on lower timeframe confirming price action…
Waiting for lower timeframe confirmation is our main tool to confirm strength within higher timeframe zones, and has really been the key to our trading success. It takes a little time to understand the subtle nuances, however, as each trade is never the same, but once you master the rhythm so to speak, you will be saved from countless unnecessary losing trades. The following is a list of what we look for:
- A break/retest of supply or demand dependent on which way you’re trading.
- A trendline break/retest.
- Buying/selling tails – essentially we look for a cluster of very obvious spikes off of lower timeframe support and resistance levels within the higher timeframe zone.
- Candlestick patterns. We tend to only stick with pin bars and engulfing bars as these have proven to be the most effective.
EUR/USD
Trade update: stopped out at breakeven – for details please see Thursday’s report.
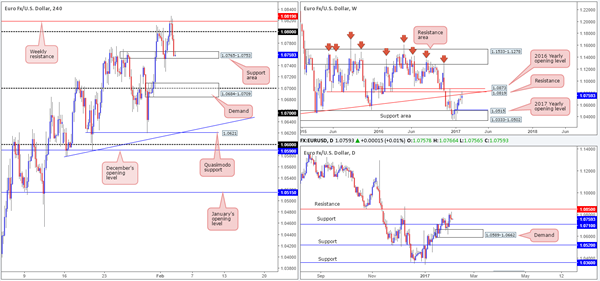
The EUR closed marginally lower yesterday after snowballing south from the weekly resistance level seen at 1.0819, which, as far as we can see, was also aided by the better-than-expected US jobless claims report. With this in mind, we feel there is a good chance that price will likely take out the H4 support area at 1.0765-1.0753 today, and maybe pull down to the 1.07 boundary. Still, to get past this psychological number, the bears would not only have to overcome 1.07, but also a H4 demand area at 1.0684-1.0709 and a daily support hurdle coming in at 1.0710 (the next downside target on the daily timeframe).
Our suggestions: Watch for a H4 close to form beyond the current H4 support area, and then look to take advantage of any retest seen to the underside of this zone as resistance. In an ideal world, we’d also like to see the retest accompanied by a lower-timeframe sell signal (see the top of this report), since this will likely get you in at a better price and allow for a smaller stop. Should this come to fruition, 50% of the position is to be liquidated around the 1.07 region, and risk reduced to breakeven. Today’s non-farm employment change is expected to come in at 170K for January, which could help push the EUR in our direction.
Data points to consider: US employment report at 1.30pm, FOMC member Evans speaks at 2.15pm and the US ISM non-manufacturing reading at 3pm GMT.
Levels to watch/live orders:
- Buys: Flat (stop loss: N/A).
- Sells: Watch for a H4 close to be seen below 1.0765-1.0753 and then look to trade any retest seen thereafter ([waiting for a lower-timeframe confirming setup to form following the retest is advised prior to pulling the trigger] stop loss: dependent on where one confirms this area).
GBP/USD
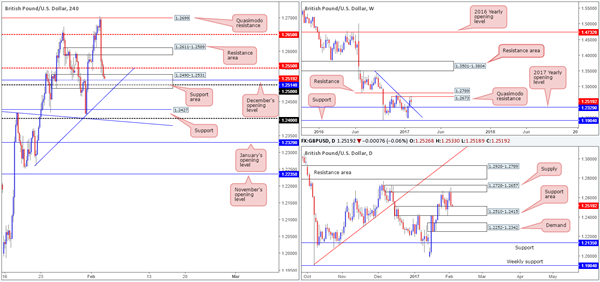
For those who read our previous report on the GBP you may remember that we highlighted the 1.27 region as a potential level to sell from, given its surrounding confluence (H4 Quasimodo resistance at 1.2699 and housed within a daily supply at 1.2728-1.2657, as well as positioned only 25 or so pips above the weekly Quasimodo resistance at 1.2673). Helped by the BoE signaling that interest-rate hikes may not be seen for a while the unit reacted from this angle almost to-the-pip, consequently snapping a two day bullish phase and ending the day forming a bearish engulfing candle. Well done to any of our readers who managed to lock in a position here!!!
As of current prices, the H4 candles recently shook hands with a H4 support area drawn from 1.2490-1.2531, which is positioned around the top edge of a daily support area at 1.2510-1.2415, and also houses both the 1.25 hurdle and December’s opening base at 1.2514. While this zone looks prime to support a rotation to the upside today, our only concern is that the weekly chart indicates that there’s room for sterling to move lower down to weekly support coming in at 1.2329.
Our suggestions: With the weekly signaling that further selling could be on the cards, our team has come to a consensus that the current H4 support area will only be considered a valid buy zone if, and only if, we see a reasonably sized bullish candle form that closes above the H4 mid-way resistance level at 1.2550.
Data points to consider: UK services PMI at 9.30am. US employment report at 1.30pm, FOMC member Evans speaks at 2.15pm and the US ISM non-manufacturing reading can be viewed at 3pm GMT.
Levels to watch/live orders:
- Buys: 1.2490-1.2531 ([wait for a H4 bull candle to form before looking to execute a trade] stop loss: ideally beyond the trigger candle).
- Sells: Flat (stop loss: N/A).
AUD/USD
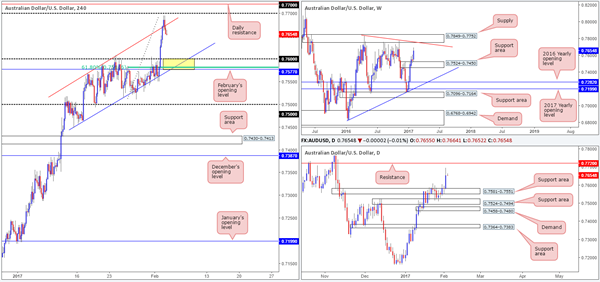
Yesterday’s action began with Australia’s trade balance reporting a $3.5b surplus in December, up from $2.0 b in November. The Aussie bulls immediately rose up and took charge, rallying over 70 pips on the day (open/close). Psychological resistance 0.76 was consumed during the bullish assault, allowing price to challenge the H4 channel resistance extended from the high 0.7569. As you can see, price whipsawed through this upper barrier and missed connecting with the 0.77 handle by only a few pips before descending lower into the close. With the H4 candles now trading back within the H4 ascending channel, will we see price tumble lower to connect with the H4 channel support drawn from the low 0.7449?
According to the higher-timeframe structures, the only way is up! Both the weekly and daily charts show little resistance on the horizon, with the closest barrier set at 0.7720: a daily resistance level that is located 30 or so pips ahead of a weekly supply at 0.7849-0.7752 (the next upside target on the weekly scale).
Our suggestions: While it is tempting to short back into the H4 channel zone, we feel the better location to trade from is around the 0.76 boundary. Building a case for entry here we have the following: the H4 channel support taken from the low 0.7449, a H4 61.8% Fib support at 0.7580, February’s opening level at 0.7577 and of course, the top edge of a daily support area at 0.7581 (yellow rectangle). This trade zone will remain valid as long as price does NOT connect with the above noted daily resistance beforehand.
Data points to consider: Chinese Caixin Manufacturing PMI at 1.45am. US employment report at 1.30pm, FOMC member Evans speaks at 2.15pm and the US ISM non-manufacturing reading can be viewed at 3pm GMT
Levels to watch/live orders:
- Buys: 0.7577/0.76 ([possible area to look at buying from without the need for additional confirmation] stop loss: 0.7574).
- Sells: Flat (stop loss: N/A).
USD/JPY
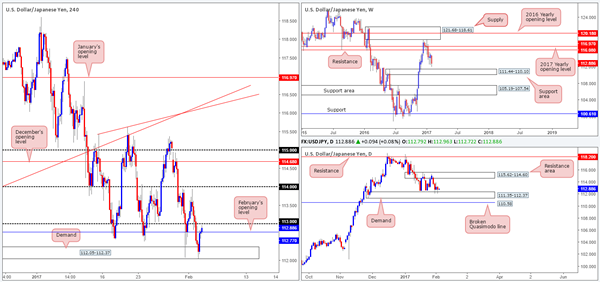
In recent sessions, the USD/JPY dive bombed deep into the jaws of a H4 demand zone at 112.05-112.37, and, as you can see, just as aggressively rotated back to the upside. This H4 demand boasts support from the top edge of a daily demand coming in at 111.35-112.37, which itself is reinforced by a weekly support area penciled in at 111.44-110.10. While the H4 candles are currently seen hovering above February’s opening base at 112.77, the bulls still have to contend with the opposing 113 handle, before the pathway north is potentially cleared up to the 114 neighborhood.
Our suggestions: Wait for a H4 close above the 113 handle to take shape. To our way of seeing things, this would not only further confirm upside strength from the aforementioned daily demand, but also possibly give traders the opportunity to trade any (confirmed) retest seen at 113 as support.
Data points to consider: US employment report at 1.30pm, FOMC member Evans speaks at 2.15pm and the US ISM non-manufacturing reading can be viewed at 3pm GMT.
Levels to watch/live orders:
- Buys: Watch for a H4 close to be seen above 113 and then look to trade any retest seen thereafter ([waiting for a reasonably sized H4 bull candle to form following the retest is advised prior to pulling the trigger] stop loss: dependent on where one confirms this area).
- Sells: Flat (stop loss: N/A).
USD/CAD:
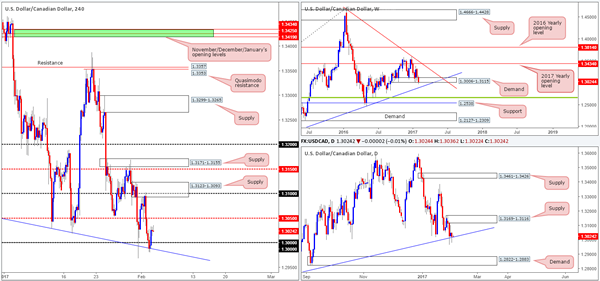
Using a top/down approach this morning, the weekly timeframe shows that the buyers and sellers remain battling for position around the lower edge of a weekly demand base drawn in at 1.3006-1.3115. In the event of this zone giving way, the next downside objective falls in around a weekly trendline support taken from the high 1.1278. Winding down into the daily timeframe, a daily trendline support extended from the low 1.2654 is seen in play at the moment. The next upside hurdle from this angle comes in at 1.3169-1.3116: a daily supply. Conversely, should the buyers fail to uphold this trendline, daily demand at 1.2822-1.2883 will likely be the next target on the hit list, which happens to converge beautifully with the above noted weekly trendline support!
Stepping across to the H4 candles, we can see that the combined 1.30 psychological band/H4 trendline support from the low 1.3080 was sufficient enough to rebound price yesterday. Well done to any of our readers who managed to lock down a position from here as this was a noted zone to watch for potential long opportunities.
Our suggestions: Right now, the only area that jumps out to us is the 1.30 region again. A retest of this boundary, alongside a lower-timeframe confirmed buy setup (see the top of this report) would be enough to buy this market, in our opinion, targeting the H4 mid-way resistance point 1.3050 as an initial take-profit zone.
Data points to consider: US employment report at 1.30pm, FOMC member Evans speaks at 2.15pm and the US ISM non-manufacturing reading can be viewed at 3pm GMT.
Levels to watch/live orders:
- Buys: 1.30 region ([wait for a lower-timeframe confirming buy setup to form before looking to execute a trade] stop loss: ideally beyond the trigger candle).
- Sells: Flat (stop loss: N/A).
USD/CHF
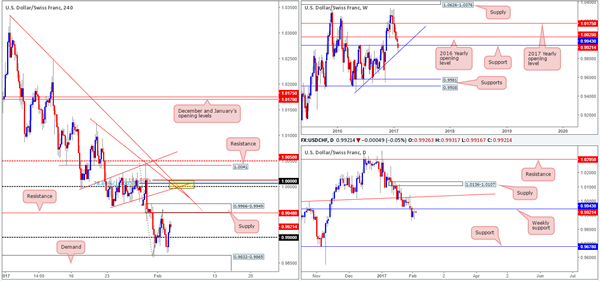
USD/CHF prices are little changed this morning, despite ranging around 70 pips on the day. To make a long story short, here is what our eyes are drawn to on the H4 chart currently:
- Parity (1.0000). A number watched by the majority of the market.
- Three H4 trendline resistances that merge beautifully with 1.0000 (0.9959/1.0335/1.0122).
- H4 Fib extension 161.8% at 1.0012.
- H4 Fib retracement 78.6% at 1.0005.
- 1.0000 also sits just below a daily trendline resistance drawn from the high 0.9956.
With confluence as strong as the above, we would usually place a pending order. However, seeing as there is a 2016 yearly opening level lurking just above this region at 1.0029, we may have to wait for confirmation in order to avoid any potential fakeout.
Our suggestions: Simply, keep an eye on the 1.0000 region today. Should price strike this zone, look for signs on the lower timeframes that the bulls are weakening. This could be either a demand engulf followed by a retest as supply, a trendline break/retest or simply a collection of well-defined selling wicks around the big number.
Data points to consider: US employment report at 1.30pm, FOMC member Evans speaks at 2.15pm and the US ISM non-manufacturing reading can be viewed at 3pm GMT.
Levels to watch/live orders:
- Buys: Flat (stop loss: N/A).
- Sells: 1.0000 neighborhood ([wait for a lower-timeframe confirming setup to form before looking to execute a trade] stop loss: dependent on where one confirms this area).
DOW 30
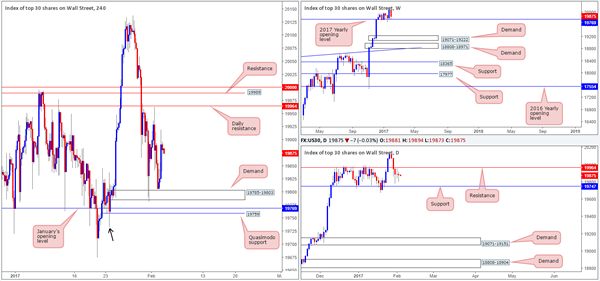
US equities closed unchanged for a second consecutive day yesterday, consequently leaving the H4 candles loitering mid-range between a daily resistance level at 19964 and a H4 demand coming in at 19785-19803. Given this, much of the following report will echo thoughts put forward in yesterday’s analysis…
Up on the weekly chart, the index is currently hovering just ahead of the 2017 yearly opening level at 19769. A decisive weekly close beyond this range could spark another wave of selling down to the weekly demand area at 19071-19222. Before this can be achieved, however, a daily close below the daily support at 19747 would, of course, need to be seen!
With the above noted H4 demand likely weakened by Tuesday’s deep test, the next level of interest on our radar is still 19759: a sneaky H4 Quasimodo support that is bolstered by the 2017 yearly opening base and the nearby daily support.
Our suggestions: With the confluence in place around the current H4 Quasimodo support, our team still has a pending buy order placed at 19760, and a stop set just below the apex of the Quasimodo formation (see black arrow) at 19730. Be that as it may, in that we have the US employment report hitting the wire later on, we may, dependent on the figures, consider removing our order.
Data points to consider: US employment report at 1.30pm, FOMC member Evans speaks at 2.15pm and the US ISM non-manufacturing reading can be viewed at 3pm GMT.
Levels to watch/live orders:
- Buys: 19760 ([pending order] stop loss: 19730).
- Sells: Flat (stop loss: N/A).
GOLD
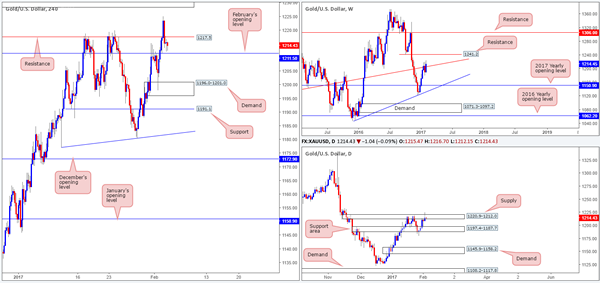
Across the board, we saw the US dollar catch a bid from lows of 99.23 (see the US dollar index), which, as you can see, led to a selloff being seen in the gold market. In order for the H4 candles to continue pushing lower, however, February’s opening level at 1211.5 will need to be consumed. The next area of interest seen beyond this monthly base is a H4 demand coming in at 1196.0-1201.0.
Looking over to the daily chart, yesterday’s trading managed to chalk in a relatively nice-looking daily selling wick that pierced the top edge of a daily supply zone at 1220.9-1212.0. What’s interesting here is that the above noted H4 demand sits on top of a daily support area at 1197.4-1187.7 – the next downside target on the daily timeframe!
Our suggestions: While both the H4 and daily charts suggest lower prices might be at hand, the weekly candle is currently hovering ABOVE a weekly trendline resistance etched from the low 1130.1. Therefore, to sell this market we would require not only a H4 close beyond Feb’s opening level, but also a retest followed up by a lower-timeframe sell signal (see the top of this report). In addition to this, it may be worth noting that the might NFP is just around the corner. Trading 30 minutes pre/post this event is something we would not advise!
Levels to watch/live orders:
- Buys: Flat (stop loss: N/A).
- Sells: Watch for a H4 close to be seen below 1211.5 and then look to trade any retest seen thereafter ([waiting for a lower-timeframe signal to form following the retest is advised prior to pulling the trigger] stop loss: dependent on where one confirms this area).


