


TL;DR: Sterling’s rally started before today’s stronger UK GDP data—markets now price an 89.2% probability of a November BoE hike and a terminal rate near 4.86%, with GDP confirming the hawkish repricing already underway rather than triggering it.
Why This Matters
It’s tempting to credit a strong data release for a currency’s rally on the day it lands, but the sequencing here tells a different story. Sterling was already moving on central bank signaling before GDP confirmed it, and understanding that order matters for how durable the move is likely to be. The same energy-inflation shock pushing the BoE toward more hikes now is also the one economists warn could weaken demand and squeeze fiscal policy later—which is why this reads as a strong week for Sterling, not yet a new multi-week trend.
Sterling’s Rally Started Before the GDP Beat
Sterling is posting its broadest gains of the week, but today’s stronger UK GDP data is better understood as the latest confirmation of a BoE repricing already underway, rather than the origin of the move.
The sequence matters. Bank of England Governor Andrew Bailey first highlighted the difficulty of maintaining unchanged policy if persistently high energy prices continue to lift inflation pressure. Deputy Governor Dave Ramsden then went further on Monday, explicitly leaving open the case for another hike if upside inflation risks keep building. Sterling rebounded from recent lows as markets moved aggressively toward a November increase.
Today’s GDP revision landed on top of that already-forming policy story. Markets now assign around an 89.2% probability to a November hike, with the implied post-meeting rate at roughly 3.97% against the current 3.75%. That equates to about 22 basis points of tightening priced for the meeting, almost a full 25bp increase.
The key point is therefore not that GDP suddenly turned Sterling bullish. GDP confirmed the Sterling trade. It did not create it.
November Is Nearly Priced, but the Curve Goes Much Further
The repricing is also much broader than a one-and-done November move. Market pricing implies around 1.5 cumulative hikes by December, roughly 2.4 by February 2027, around 3.7 by April, and approximately 4.5 by September 2027, taking the implied terminal rate toward 4.86%.
That is a substantial shift in the expected policy path. But the curve is not pricing a simple sequence of back-to-back hikes. Per-meeting probabilities dip at several points, including around March and June, implying a more measured hike-then-pause pattern rather than uninterrupted tightening at every meeting. That distinction matters because it suggests markets are not betting on a rapid emergency tightening cycle. Instead, they are increasingly pricing the idea that inflation persistence may require the BoE to deliver multiple additional adjustments over time.
The energy shock sits at the centre of that repricing. Bailey and Ramsden have both emphasized the inflation risk created by persistently high energy prices, tying the UK story into the same oil-driven inflation theme already running through the Fed, RBA and broader global rates outlook.
GDP Confirms Resilience, but Trade Did Much of the Heavy Lifting
The revised GDP numbers give the BoE hawks more room to argue that the economy can withstand tighter policy. UK GDP growth in Q2 was revised from 0.4% to 0.5% q/q, following an unrevised 0.6% expansion in Q1. GDP is now estimated to be 2.0% above its Q4 2024 level, revised up from 1.9%. The first-half growth profile is therefore stronger than previously thought. But the composition deserves more attention than the headline alone.
On the output side, growth was relatively broad, with services up 0.6% and construction up 0.8%, while production slipped 0.1%. On the expenditure side, however, growth leaned much more heavily on net trade. Export volumes rose 2.8%, sharply revised from the initial 0.5% estimate, with goods exports up 3.7% and fuels making an important contribution. Household consumption increased only 0.3%, while government consumption fell 0.5%. That makes the GDP beat supportive, but not a picture of uniformly strong domestic demand.
Public-Sector Weakness Was Partly Distorted by the Heatwave
The fall in government consumption also needs some context. The ONS attributed part of the weakness to the June heatwave, which forced school closures and contributed to a 0.4% fall in education output, the largest negative sector contribution. That makes the public-sector drag less useful as evidence of underlying demand weakness.
Business investment was also encouraging, rising 5.2% y/y, while gross fixed capital formation more broadly increased 0.9% q/q and 3.1% y/y. Those figures should be kept distinct, but together they reinforce the broader point that parts of the private economy remain resilient even as household spending growth remains comparatively modest.
Household Incomes Recover, but Consumers Are Still Cautious
The household data also improved. Real household disposable income per head rose 1.0% q/q, the strongest increase since late 2024, after falling 0.8% in Q1. But households did not immediately translate all of that improvement into stronger consumption.
The saving ratio increased from 8.6% to 8.8%. Within that, non-pension saving rose from 3.8% to 4.5%, while the pension component declined from 4.8 percentage points to 4.3 points. That suggests households had more real income available in Q2, but still retained a cautious stance. The result is another reason to describe the GDP data as resilient rather than booming.
The Same Inflation Shock Creates a Q4 Problem
There is also a growing tension between the factors supporting Sterling now and the factors that could constrain the economy later. The same energy-price shock driving the BoE toward a more hawkish stance is also threatening household purchasing power and increasing pressure on public finances. General government net borrowing rose from 4.2% of GDP in Q1 to 5.2% in Q2, giving the fiscal side of the story considerably more weight ahead of the October 28 Budget.
Economists cited in the handover have warned that the resilience visible through the first half may fade into Q4 as inflation erodes real income growth and the government faces pressure to tighten fiscal policy. That creates a genuine two-sided Sterling story: near term, persistent inflation and resilient activity support higher BoE rates; further out, the same inflation shock may weaken demand and increase the risk of fiscal tightening. The forces supporting Sterling now could therefore become the forces constraining growth later.
ActionForex’s Technical View on EUR/GBP and GBP/CHF
EUR/GBP Tests the 0.8551 Breakdown Point
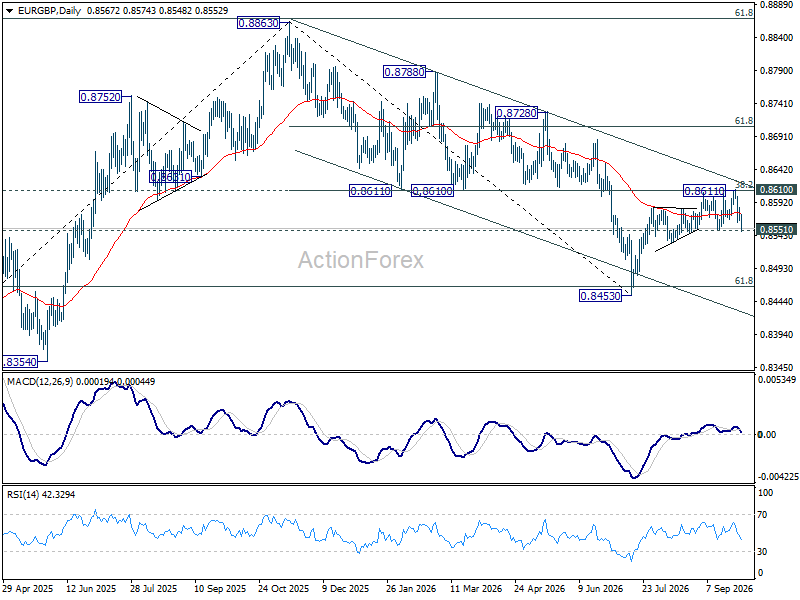
The technical picture in EUR/GBP is increasingly aligned with the fundamental divergence.
The pair is pressing 0.8551 support after repeatedly failing around the 0.8610–0.8611 resistance cluster.
That area combines former support turned resistance, the 38.2% retracement of the decline from 0.8863 to 0.8453, and the weekly 55 EMA. Price also remains contained within the broader medium-term falling channel.
A firm break below 0.8551 would suggest that the rebound from 0.8453 completed at 0.8611 as a corrective move only.
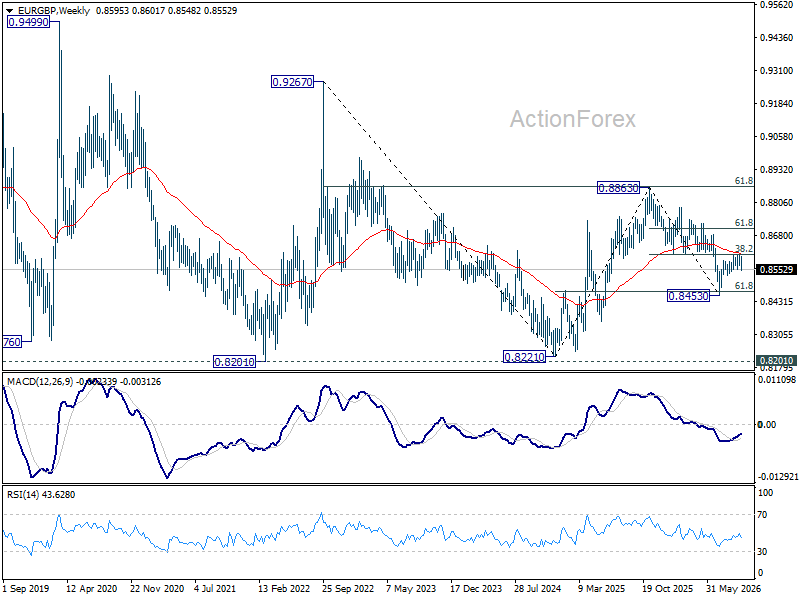
That would bring the 0.8453 low back into focus, with nearby 0.8466 marking the 61.8% retracement of the 0.8221–0.8863 advance.
A decisive break through that support zone would materially raise the risk of a medium-term retest of the 0.8221 low.
For now, the bearish EUR/GBP case remains favored while 0.8611 resistance holds.
GBP/CHF Presses 1.1066 as Sterling Strength Broadens
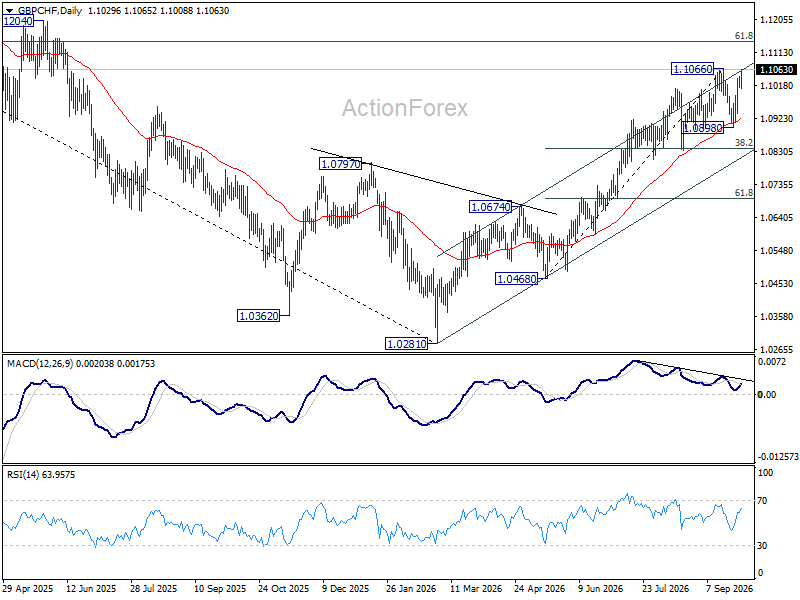
GBP/CHF offers the complementary bullish Sterling setup.
The rebound from 1.0898 has extended back toward 1.1066 resistance, while the daily 55 EMA has provided solid support underneath the move.
A firm break of 1.1066 would resume the broader advance from 1.0281 and could also force a break through the upper boundary of the rising channel.
That would expose 1.1142, the 61.8% retracement of the decline from 1.1675 to 1.0281.
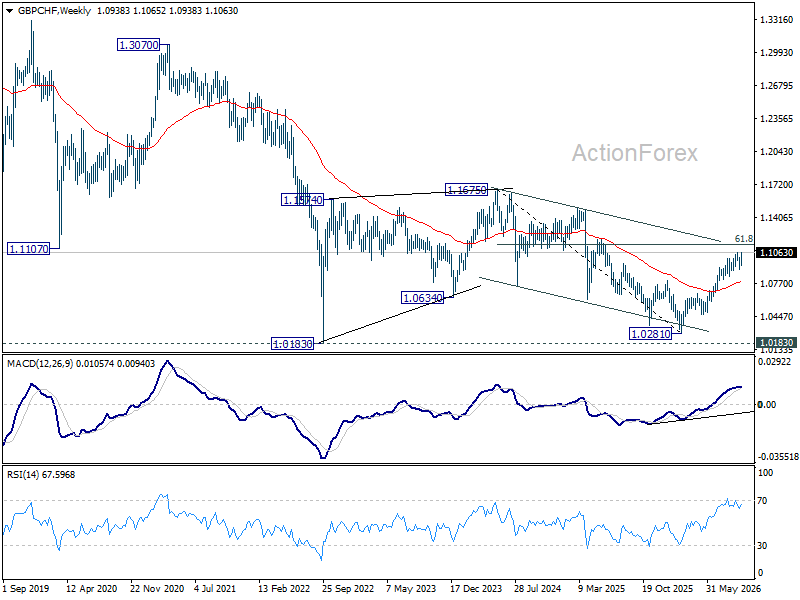
A sustained break above 1.1142 would strengthen the case for a larger return toward the 1.1675 high.
Near term, the bullish setup remains intact while 1.0898 support holds.
Taken together, a EUR/GBP breakdown and GBP/CHF breakout would provide stronger evidence that Sterling strength is becoming broad-based rather than remaining confined to one bilateral pair.
Strong Sterling Setup, but Not Yet a New Multi-Week Trend
For now, fundamentals and technicals are aligned. Sterling is outperforming broadly. Markets are pricing a much steeper BoE path. GDP has been revised higher. EUR/GBP is pressing support, while GBP/CHF is testing resistance. But the durability of the move is not yet guaranteed.
The current Sterling advantage rests partly on the same energy-driven inflation shock that could later weaken household demand and increase fiscal pressure. That makes this a strong week for Sterling, but not yet sufficient evidence of a durable new multi-week trend. The immediate policy case is becoming more hawkish. The medium-term growth cost of that hawkishness is only beginning to emerge.
Key Takeaways
- Sterling’s rally was underway before today’s GDP data, driven by hawkish BoE signaling from Bailey and Ramsden that pushed November hike odds to 89.2%.
- Rate markets now price a terminal rate near 4.86%, with a measured hike-then-pause path rather than back-to-back tightening.
- Q2 GDP was revised up to 0.5% q/q, but the beat leaned heavily on net trade (exports +2.8%) rather than household consumption (+0.3%).
- Rising fiscal pressure—net borrowing up to 5.2% of GDP—puts extra weight on the October 28 Budget as a potential constraint on the story.
- EUR/GBP is testing 0.8551 support and GBP/CHF is testing 1.1066 resistance; breaks in both would confirm Sterling strength is becoming broad-based.





