
Dollar was sold off broadly last week as sentiments were rocked by political turmoil in the White House, regarding US President Donald Trump’s alleged intervention in FBI investigation. Selloff in equities triggered massive safe haven flows into Swiss Franc and Japanese Yen. But Euro followed closely as political risks in the Eurozone faded and on ECB expectations. Commodity currencies performed poorly in spite of the rally in oil and gold price. Aussie and Kiwi ended the week as two of the weakest major currencies, just next to Dollar. Sterling and Canadian Dollar were among the weakest batch too but showed a turnaround as oil broke 50 handle. Political uncertainty in US is set to continue as former FBI director James Comey, fired by US President Donald Trump earlier this month, agreed to testify in open session before the Senate Intelligence Committee. Dollar is vulnerable to more selling against Euro and Yen.
Dollar index could be in a medium term correction
As noted during the week, the downside acceleration in the Dollar index is now raising the chance that fall from 103.82 is indeed a medium term correction. That is, the five wave sequence from 72.69 (2011 low) has completed at 103.82 last year. This is also reflected in the decisive break of 55 week EMA. Next near term focus is 61.8% retracement of 91.91 to 103.82 at 94.46. Sustained break there should pull the index down to key long term cluster support at 91.91 (38.2% retracement of 72.69 to 103.82 at 91.93) before having solid support for rebound. And this will now be the slightly favored case as long as 99.88 near term resistance holds.
10 year yield’s fall halted but stays vulnerable
The decline in 10 year yield (TNX) somewhat halted after hitting 2.191. It’s trying to draw support from 2.177 chart support, 55 week EMA (now at 2.175), as well as 55 month EMA (now at 2.186). Also, Friday’s rebound in US stocks also helped stabilize yields. But TNX remains vulnerable to deeper decline too. Another round of downside acceleration will take out the mentioned cluster support level. And in that case, TNX could dive through 38.2% retracement of 1.336 to 2.621 at 2.130 to 61.8% retracement at 1.826 and below.
DOW in risk of a larger reversal
DJIA’s rebound and close above 55 EMA last week showed some relief from selling pressure. But downside risk is quickly increasing. Firstly, lost of momentum is clear after hitting long term channel resistance. Secondly 55 week EMA has been staying below signal line for a while. Thirdly, bearish divergence condition is seen in daily MACD. 20379.55 support will be the key level to watch in near term and break there will at least bring deeper pull back to 38.2% retracement of 17883.56 to 21169.11 at 19914.02. And in that case, there is even risk of deeper fall to 55 week EMA (now at 19453.00). Meanwhile, in case of a break of 21169.11 and up trend resumption, we’ll remain skeptical until there is solid proof of upside acceleration.
Politics, FOMC minutes, Eurozone data, BoC and oil to watch
There are a couple of things to watch in the coming week, politics aside. After all the sentiments shift and market volatility, the markets are still convinced that Fed will continue with a rate hike in June. Fed fund futures are pricing in 78.5% chance of that. Markets will look into minutes of the May 3 FOMC meeting to affirm that expectation. A bunch of Eurozone data will also be closely watched, including PMIs and German IFO sentiments. Euro’s strength is built on optimism of improving Eurozone economic outlook. Also, there is expectation of an upgrade in ECB staff forecast in June, a hawkish twist in the press conference. And that could be followed by announcement of stimulus exit of some sort in September. More upside surprises in Eurozone data will give the common currency another boost.
Canadian Dollar will be a currency to watch this week. BoC is widely expected to hold interest rate unchanged at 0.50%. The central bank will likely maintain a neutral stance in spite of recent mixed batch of data. The Loonie, however, would possibly re-couple with oil price again. This could be seen in the late dive in USD/CAD through 1.3534 key support level, accompanied by WTI crude oil’s surge through 50 handle. The rally in WTI should have confirmed that the fall from 55.24 has completed as a corrective move to 43.76, after drawing support from 38.2% retracement of 26.05 to 55.234 at 44.09. The rally in oil price is set to extend to 53.76/55.24 resistance zone. That would possibly pull USD/CAD lower to 1.3222 support level.
Trading strategy – Hold EUR/AUD long, sell USD/CAD
Regarding trading strategies, we bought EUR/AUD at 1.4790 last week and the strategy is correct so far as EUR/AUD jumped to as high as 1.5074. The cross lost momentum ahead of 1.5094 resistance but there is no clear sign of topping yet. We maintain the view that the trend in EUR/AUD has reversed and further rise should be seen to 1.5455 fibonacci level and above. Hence, we’ll hold on to the long position while raising the the stop from 1.4640 to 1.4850 to protect our profits in case of rejection from 1.5094. 1.4850 is slightly below 4 hour 55 EMA.
As mentioned above, we’re expecting more weakness in Dollar in near term. Euro will likely be the better performer in the markets but we’ve already got EUR/AUD on hand. USD/JPY’s fall hesitated a bit after hitting 110.23 and therefore we prefer not to sell this one. Instead, we’ll turn to sell USD/CAD at market this week for anticipation of more strength in oil. Stop will be set at 1.3600, with slightly above 1.3570 minor resistance. 1.3222 is seen as the first target. We’ll assess the outlook later to decide the chance for reversing the whole trend from 2016 low at 1.2460.
USD/CAD Weekly Outlook
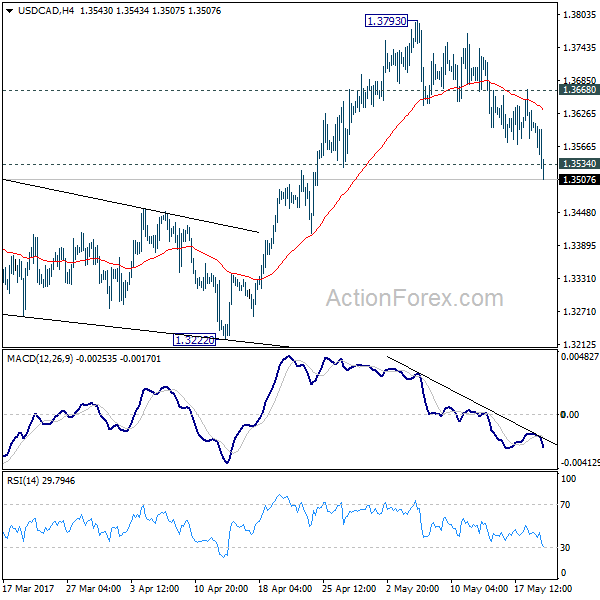
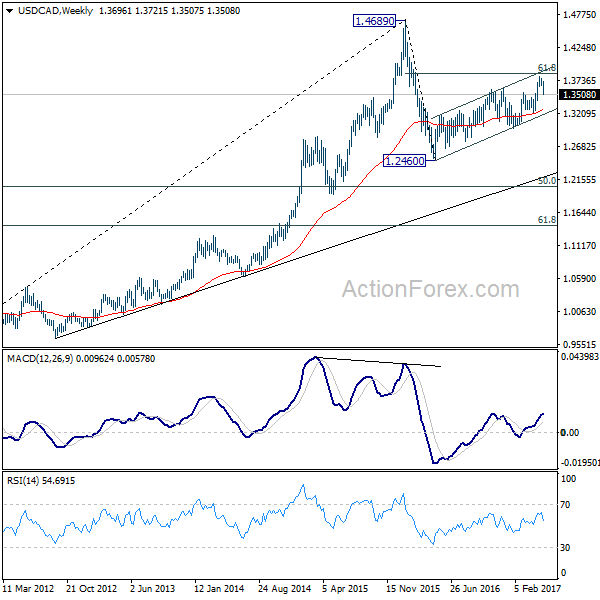
USD/CAD’s fall from 1.3793 extended to as low as 1.3507 last week and broke 1.3534 resistance turned support. The development confirmed completion of rise from 1.2968. Initial bias remains on the downside for 1.3222 support next. Also, the corrective rally from 1.2460 could have finished too, ahead of 1.3838 fibonacci level. Break of 1.3222 will affirm this case and target 1.2968 key support level for confirmation. On the upside, break of 1.3668 minor resistance is needed to indicate completion of the fall from 1.3793. Otherwise, outlook will remain cautiously bearish in case of recovery.
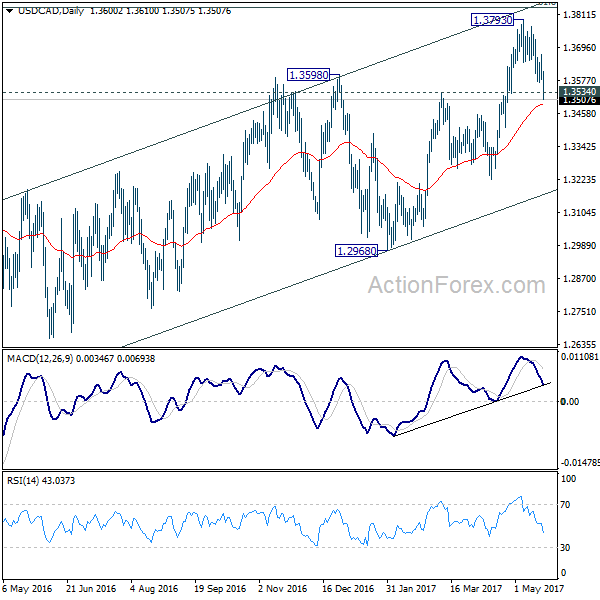
In the bigger picture, price actions from 1.4689 medium term top are seen as a correction pattern. The first leg has completed at 1.2460. Rise from 1.2460 is seen as the second leg and would end at around 61.8% retracement of 1.4689 to 1.2460 at 1.3838. Break of 1.3222 should indicate the start of the third leg while further break of 1.2968 should confirm. Nonetheless, sustained trading above 1.3838 would pave the way to retest 1.4689 high.
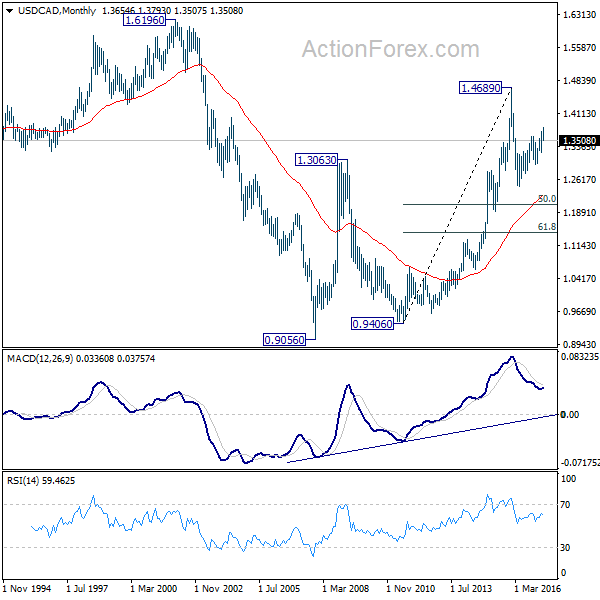
In the longer term picture, rise from 0.9056 (2007 low) is viewed as a long term up trend. It’s taking a breath after hitting 1.4689. But such rise expected to resume later to test 1.6196 down the road.


