
Dollar staged a strong rebound towards the end of the week as boosted by an overall set of solid job data. While the greenback still ended lower against Euro for the week, it’s now looking likely that the greenback has found a short term bottom already. It’s still early to confirm a trend reversal for Dollar yet. And we believe the key lies in the yet to be confirmed fiscal policy of US President Donald Trump. But for now, Dollar will probably gyrate higher in the early part of this week until CPI release on Friday. On the other hand, while Euro ended the week as the strongest currency, its rallies against Dollar, Yen and even Swiss Franc are starting to look tired. Sterling ended the week generally lower after markets perceived the BoE Super Thursday as a dovish one. But commodity currencies were even weaker with Canadian Dollar starting to pare back the strong gains in the past two months.
Dollar index starting to feel the support from 91.91/3 key cluster
Recapping the outlook of Dollar index, the fall from 103.82 is seen as a move corrective long term up trend from 72.69 (2011 low) to 103.82 (2017 high). It’s now close to key cluster support level at 91.91/93 (38.2% retracement of 72.69 to 103.82 at 91.93), which is reasonably close to 55 month EMA (now at 90.92). While Friday’s post NFP rebound doesn’t confirm trend reversal yet, we’ll start to look for more signals of bottoming. 94.28 resistance will be the first hurdle for the index. Break there will bring stronger rise back to 55 day EMA (now at 95.74). In case of another fall, we’ll still expect strong support from 91.91/93 to contain downside and bring sustainable rebound.
Treasury not confirming Dollar strength yet
In our view, the rebound in dollar has to be accompanied by rally in treasury yields to confirm the underlying inflationary force in the economy and growth momentum, and thus, a continuous tightening path of the Fed. While DOW made record high at 22092.81, strength in stocks could either be interpreted as optimism on the economy or expectation for Fed to slow down tightening. Indeed, Fed fund futures are still pricing in less than 50% chance of a rate hike by Fed by the end of the year. That suggests investors are not yet convinced that Fed policy makers are overjoyed by the NFP report.
For now 10 year yield is being supported by 2.225 level and it would extend range trading between 2.225/2.396 this year. But break of 2.396 is needed to confirm resumption of rebound from 2.103 and completion of correction from 2.621. Otherwise the choppy fall from 2.621 could still extend through 2.103 after breaking 2.225. And as long as 2.396 holds, we’ll look at dollar index’s rebound cautiously and see that as a correction. And in the longer term picture, TNX is still far off the key structure resistance at 3.036, which defines and long term down trend.
Euro rally looks tired
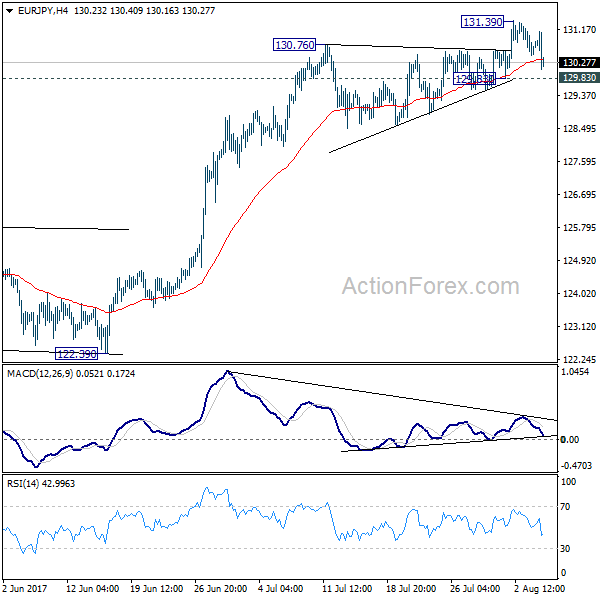
But after all, as the rally Euro is starting to look tired, favor is mildly on the Dollar’s side in near term. For example, EUR/JPY retreated sharply after initial breakout to 131.39. There is bearish divergence see in 4 hour MACD. The brief spike after triangle breakout is a typical wave five, with the triangle as wave four. EUR/JPY will likely head back to 129.83 and break will confirm short term topping. In that case, deeper decline would be seen back to 55 day EMA (now at 127.35).
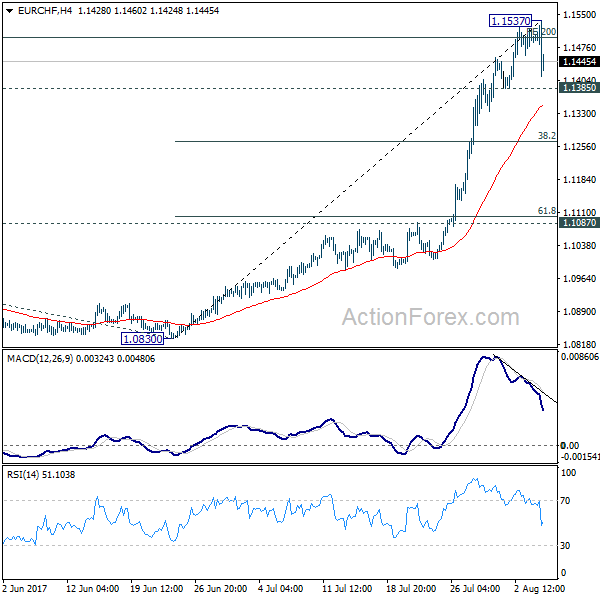
EUR/CHF also lost much momentum after extending recent high to 1.1537. Bearish divergence condition is seen in 4 hour MACD after the cross hit 200% projection of 1.0652 to 1.0986 from 1.0830 at 1.1498. Considering that it it’s also high in overbought position in daily RSI, the cross should be turning into a corrective phase. Break of 1.1385 this week will bring pull back to 38.2% retracement of 1.0830 to 1.1537 at 1.1267. Short to medium term Euro position traders could consider to lighten up their Euro long for now, and prepare to buy again later.
Trading strategy: Sell GBP/USD for a near term trade
Regarding trading strategy, we’ll look at opportunities to buy Dollar for a near term trade. Considering the above analysis, even though there is no confirmation of trend reversal yet, the greenback is in favor to move higher in near term, with help of pull back in Euro too. Sterling is considered to be the better candidate to sell against Dollar. BoE announcement last week firstly indicates that Kristin Forbes’ replacement Silvana Tenreyro is not a hawk. Growth projections for 2017 and 2018 were both revised down. And more importantly, inflation forecast for 2018 and 2019 were kept unchanged suggesting that policy makers have calmed down from the inflation surge earlier in the year. That is, the chance of an earlier hike is gone and the base case is back. BoE will hand their hands until the picture of Brexit becomes clear.
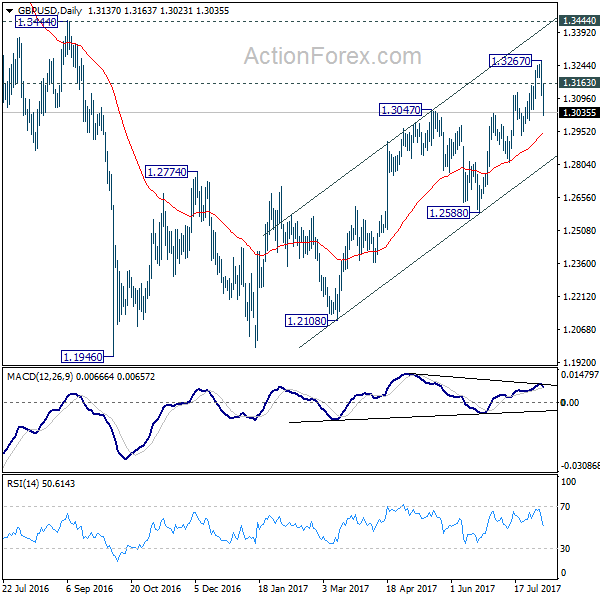
Technically, bearish divergence condition in both daily and 4 hour MACD suggests short term topping at 1.3267. And deeper fall would likely be seen back to 55 days EMA (now at 1.2938) or further to channel support (now at 1.2803). As we’re viewing price actions from 1.1946 as a correction, there is prospect of a retest of this low down the road (but it’s too early to confirm completion of the correction yet). So we’ll sell GBP/USD at market at the start of the week, with a stop at 1.3165. We’ll see how it goes when GBP/USD approaches channel support.
USD/CAD Weekly Outlook
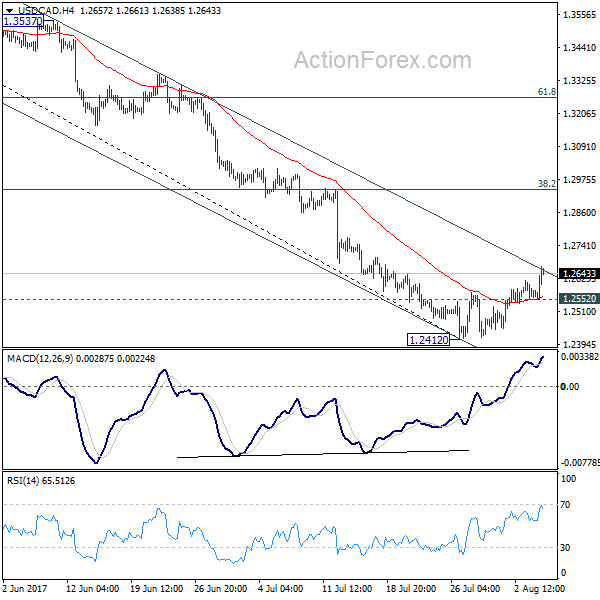
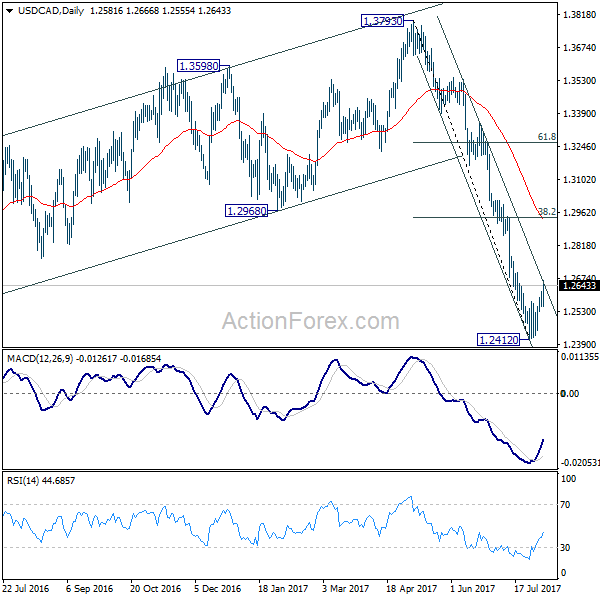
USD/CAD’s rebound last week confirmed short term bottoming at 1.2412. Initial bias stays on the upside this week. Current rebound could be corrective whole decline from 1.3793 and might target 38.2% retracement of 1.3793 to 1.2412 at 1.2940. On the downside, break of 1.2552 minor support will indicate completion of the rebound. In such case, intraday bias will be turned back to the downside for 1.2412 low.
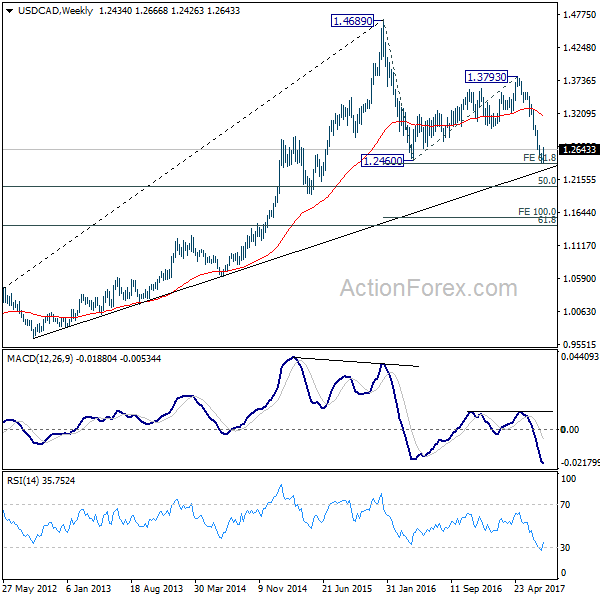
In the bigger picture, price actions from 1.4689 medium term top are seen as a correction pattern. A short term bottom is formed at 1.2412 after hitting 61.8% projection of 1.4689 to 1.2460 from 1.3793 at 1.2415. But there is no sign of completion of the correction yet. Break of 1.2412 will target 50% retracement of 0.9406 to 1.4869 at 1.2048. At this point, we’d look for strong support from there to contain downside and bring rebound. Meanwhile, sustained break of 1.2968, 38.2% retracement of 1.3793 to 1.2412 at 1.2940 will be the first sign of completion of the correction and will turn focus back to 1.3793 key resistance.
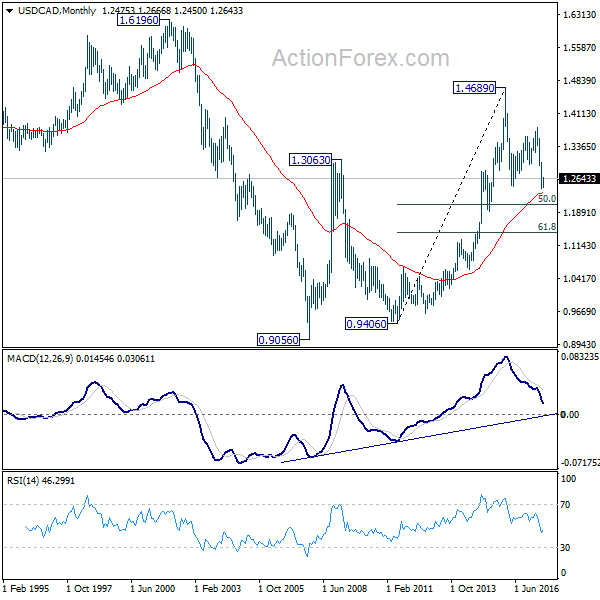
In the longer term picture, rise from 0.9056 (2007 low) is viewed as a long term up trend. It’s taking a breath after hitting 1.4689. But such rise is expected to resume later to test 1.6196 down the road. But firm break of 50% retracement of 0.9406 to 1.4869 at 1.2048 will raise doubt over this view.


