USDCAD Outlook
USD/CAD Daily Outlook
Daily Pivots: (S1) 1.3564; (P) 1.3600; (R1) 1.3644; More...
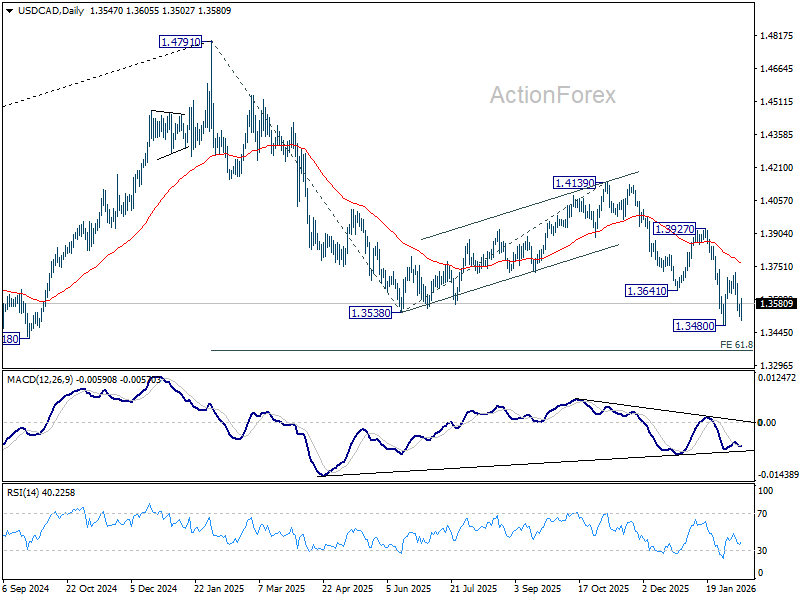
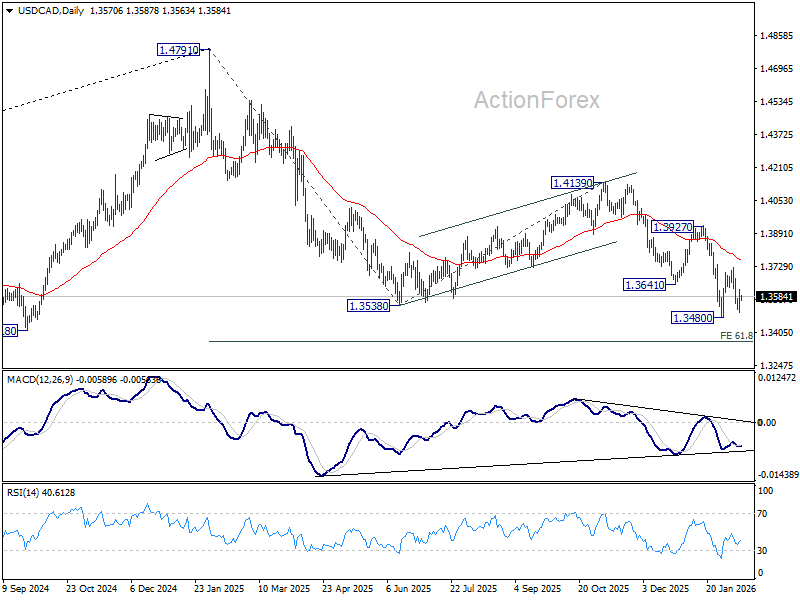
USD/CAD is extending the consolidation pattern from 1.3480 and intraday bias stays neutral. Strong rebound cannot be ruled out, but upside should be limited by 55 D EMA (now at 1.3757). On the downside, break of 1.3480 low will resume larger down trend from 1.4791 to 61.8% projection of 1.4791 to 1.3538 from 1.4139 at 1.3365.
In the bigger picture, price actions from 1.4791 are seen as a corrective pattern to the whole up trend from 1.2005 (2021 low). Deeper fall could be seen as the pattern extends, to 61.8% retracement of 1.2005 to 1.4791 at 1.3069. For now, medium term outlook will be neutral at best, until there are signs that the correction has completed, or that a bearish trend reversal is confirmed.
USD/CAD Daily Outlook
Daily Pivots: (S1) 1.3515; (P) 1.3567; (R1) 1.3630; More...
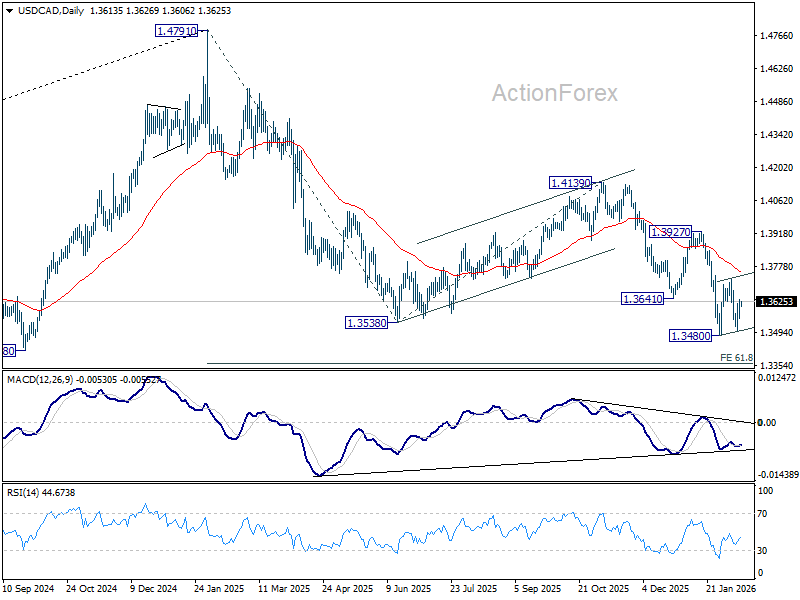
Intraday bias in USD/CAD is neutral for the moment as consolidation pattern from 1.3480 is extending. Strong rebound cannot be ruled out, but upside should be limited by 55 D EMA (now at 1.3757). On the downside, break of 1.3480 low will resume larger down trend from 1.4791 to 61.8% projection of 1.4791 to 1.3538 from 1.4139 at 1.3365.
In the bigger picture, price actions from 1.4791 are seen as a corrective pattern to the whole up trend from 1.2005 (2021 low). Deeper fall could be seen as the pattern extends, to 61.8% retracement of 1.2005 to 1.4791 at 1.3069. For now, medium term outlook will be neutral at best, until there are signs that the correction has completed, or that a bearish trend reversal is confirmed.
USD/CAD Mid-Day Outlook
Daily Pivots: (S1) 1.3524; (P) 1.3552; (R1) 1.3582; More...
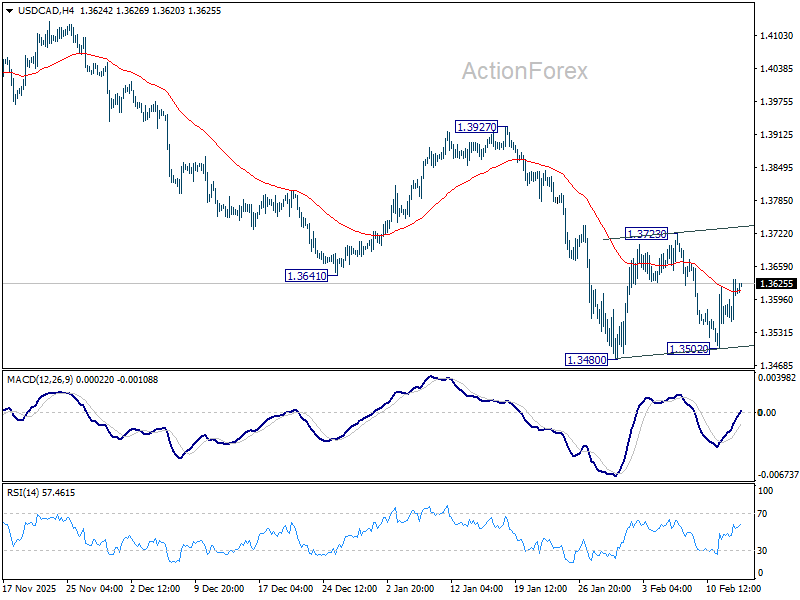
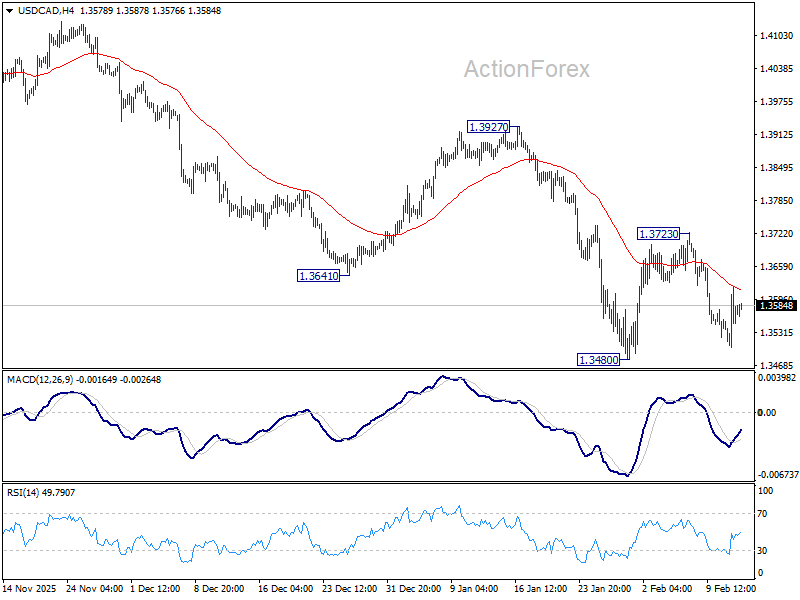
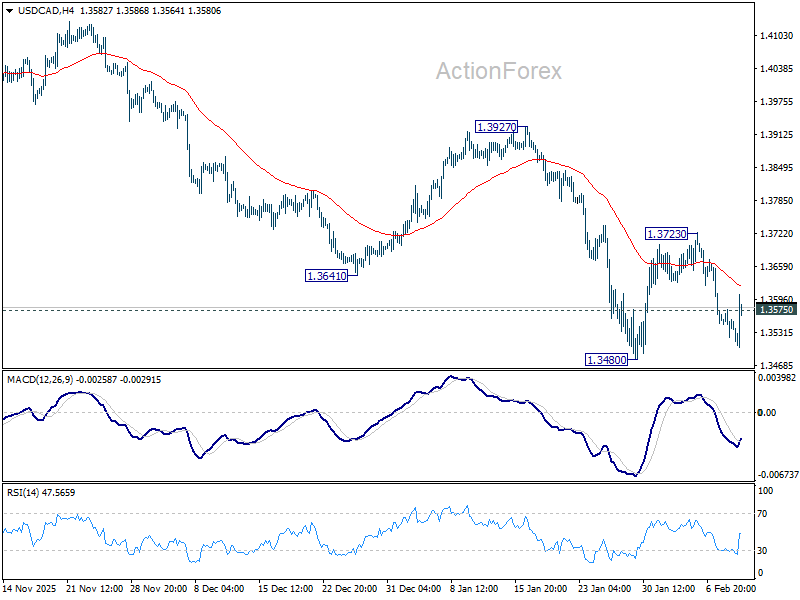
USD/CAD's break of 1.3575 minor resistance suggests that corrective pattern from 13.480 is extending with another rising leg. Firm break of 55 4H EMA (now at 1.3620) will bring stronger rebound to 1.3723 resistance. But upside should be capped by 55 D EMA (now at 1.3763). On the downside, break of 1.3480 low will resume larger down trend from 1.4791 to 61.8% projection of 1.4791 to 1.3538 from 1.4139 at 1.3365.
In the bigger picture, price actions from 1.4791 are seen as a corrective pattern to the whole up trend from 1.2005 (2021 low). Deeper fall could be seen as the pattern extends, to 61.8% retracement of 1.2005 to 1.4791 at 1.3069. For now, medium term outlook will be neutral at best, until there are signs that the correction has completed, or that a bearish trend reversal is confirmed.