
Nowadays, popular trading platforms offer in excess of 100 indicators. You could say you are almost spoilt for choice. The mammoth selection, however, tends to be detrimental, often leaving traders overwhelmed, particularly those in the earlier junctures of their journey.
Fortunately, a handful of indicators have stood the test of time.
Including, but certainly not limited to, the Slow Stochastic, The Moving Average Convergence & Divergence (MACD), Moving Averages and the Relative Strength Index (RSI) are well known among the technical community.
For the purpose of this piece, though, focus is drawn towards the RSI.
Getting to know the RSI indicator
Developed by J. Welles Wilder, and presented in his book New Concepts in Technical Trading Systems (1978), the RSI remains a prominent momentum oscillator – momentum is the rate of the rise or fall in price.
The RSI calculates momentum as a ratio of higher price closes over lower closes. For example, markets experiencing more upside momentum naturally have a higher RSI reading.
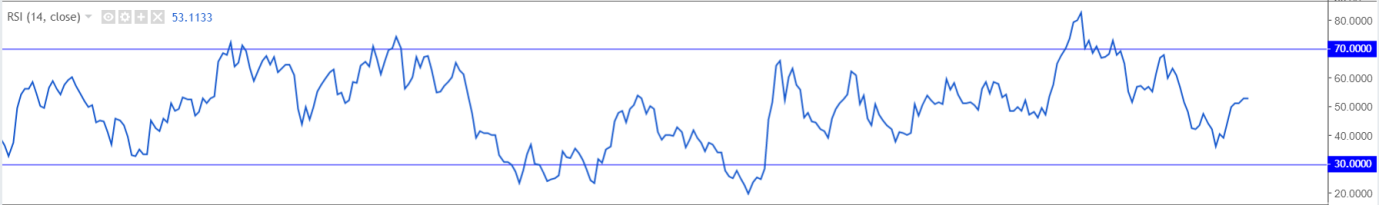
As is evident from the image below, the indicator is basic in form, oscillating between 0-100. In addition to this, an exponential moving average (EMA) is applied to its canvas, along with high and low levels marked at 70 and 30.
RSI settings
The RSI indicator’s default calculation is 14 periods, the suggested value by Wilder in his book. This means the indicator examines the closing price of 14 candles to create a reading on the timeframe being analysed.
Although 14 is the default, a number of settings are available which typically depends on the trading strategy employed:
- Short-term intraday traders (day trading) may favour lower settings using periods of 9-11.
- Medium-term swing traders tend to adopt the default setting of 14.
- Longer-term position traders normally prefer a higher period, ranging from 20-30.
In terms of the indicator’s calculation, today’s trading platforms are capable of performing the RSI calculation automatically, leaving traders free to focus on what’s important. For those who wish to understand the numbers behind the RSI, nevertheless, here’s a brief look at its calculation:
RSI = average gain in the period / loss in the period.
RSI = 100 – (100 / [1 + RS]).
Average gain is calculated as (previous average gain * (period – 1) + current gain) / period except for the first day which is just an SMA. The average loss is similarly calculated using losses.
The many uses of the RSI indicator
Overbought and Oversold:
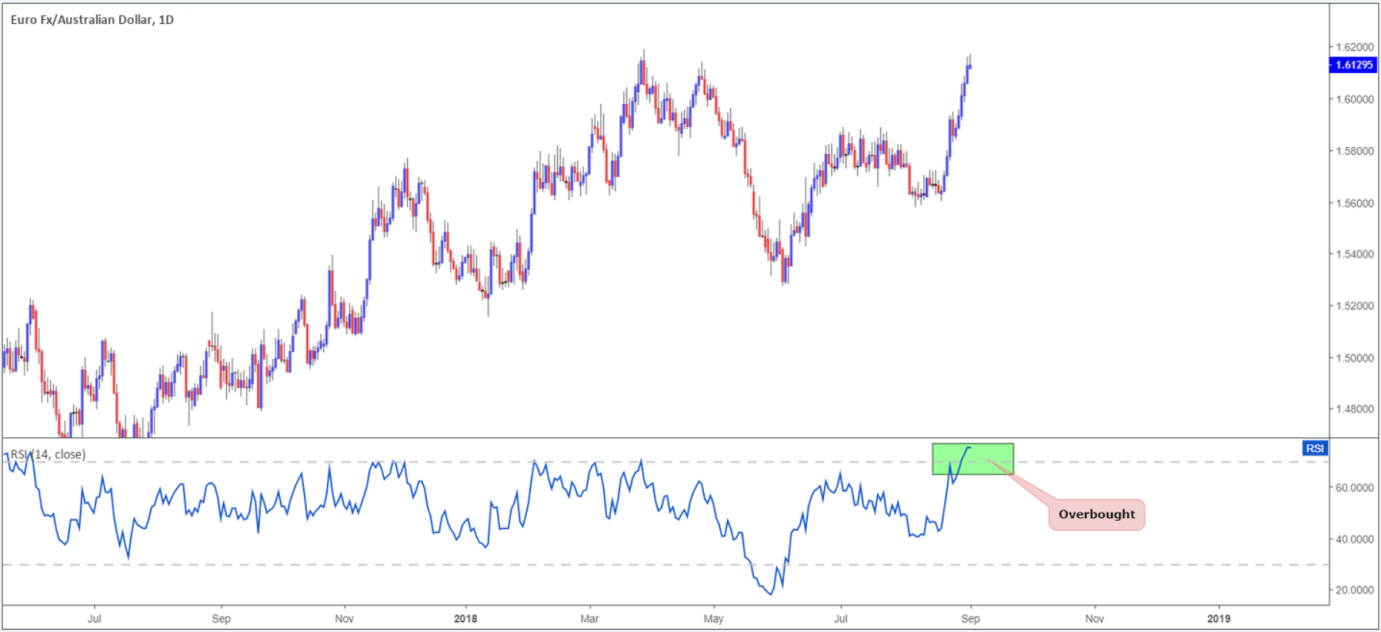
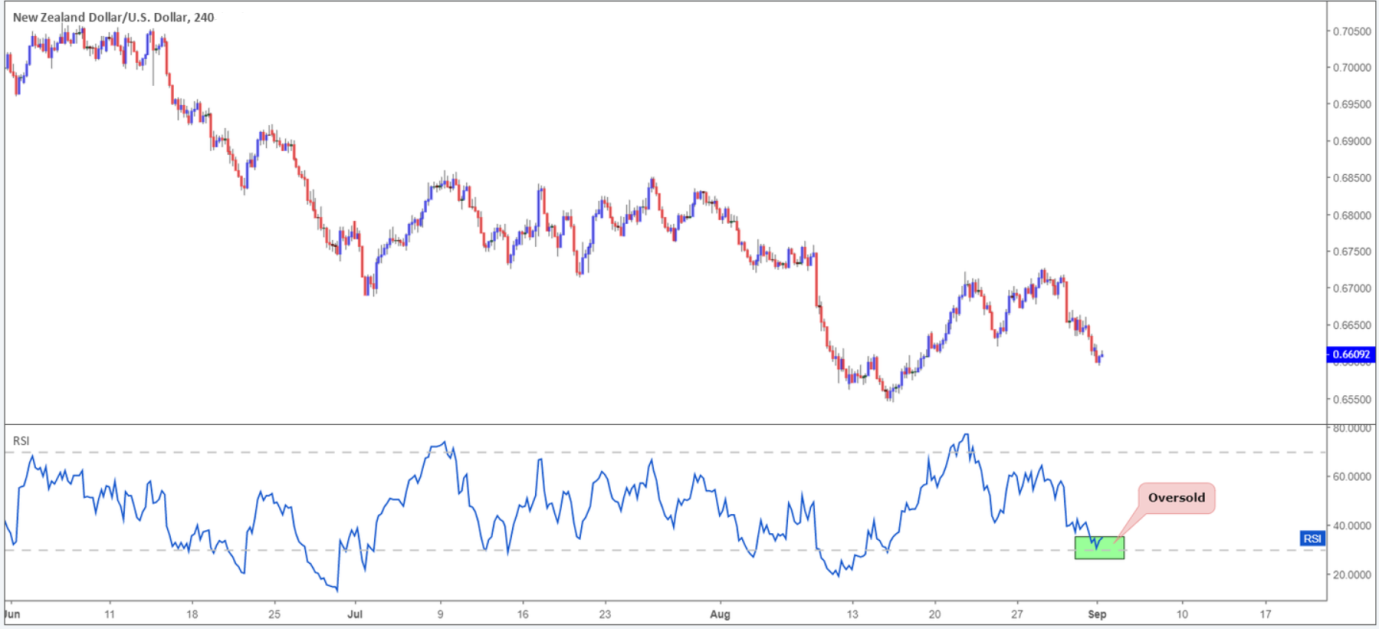
Traditionally, an RSI value beyond 70 indicates overbought conditions, whereas an RSI value below 30 suggests oversold conditions.
These two terms are relatively self-explanatory. An overbought level describes consistent upward moves over a period of time and can alert traders to a potentially waning market, or weakening trend. The term oversold, nonetheless, defines consistent downward moves visible over a period of time, and thus reflects a possible trend reversal to the upside is in the offing.
In addition to the above, traders also need to take into account the RSI can remain overbought or oversold for extended periods in trending environments. This is important to recognize as it can lead to numerous false signals. To help tackle this, some traders elect to use more extreme values in the range of 80-20 as an alternative to the traditional 70-30.
Divergence:
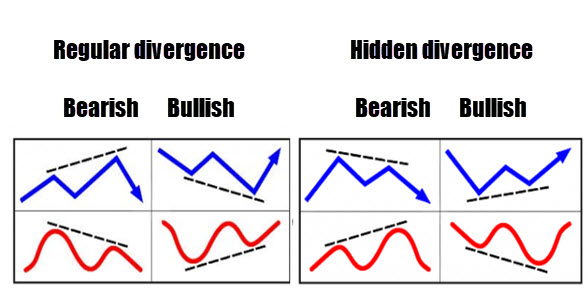
Divergence occurs when underlying price movement (the candlesticks) prints a fresh high/low that is not confirmed by the RSI. To the side are two examples of divergences seen regularly in the market (blue signifies price action and red represents RSI movement).
To help solidify the image, here is an example of regular bearish divergence on a trading chart – the opposite of this is simply a mirror version offering regular bullish divergence:
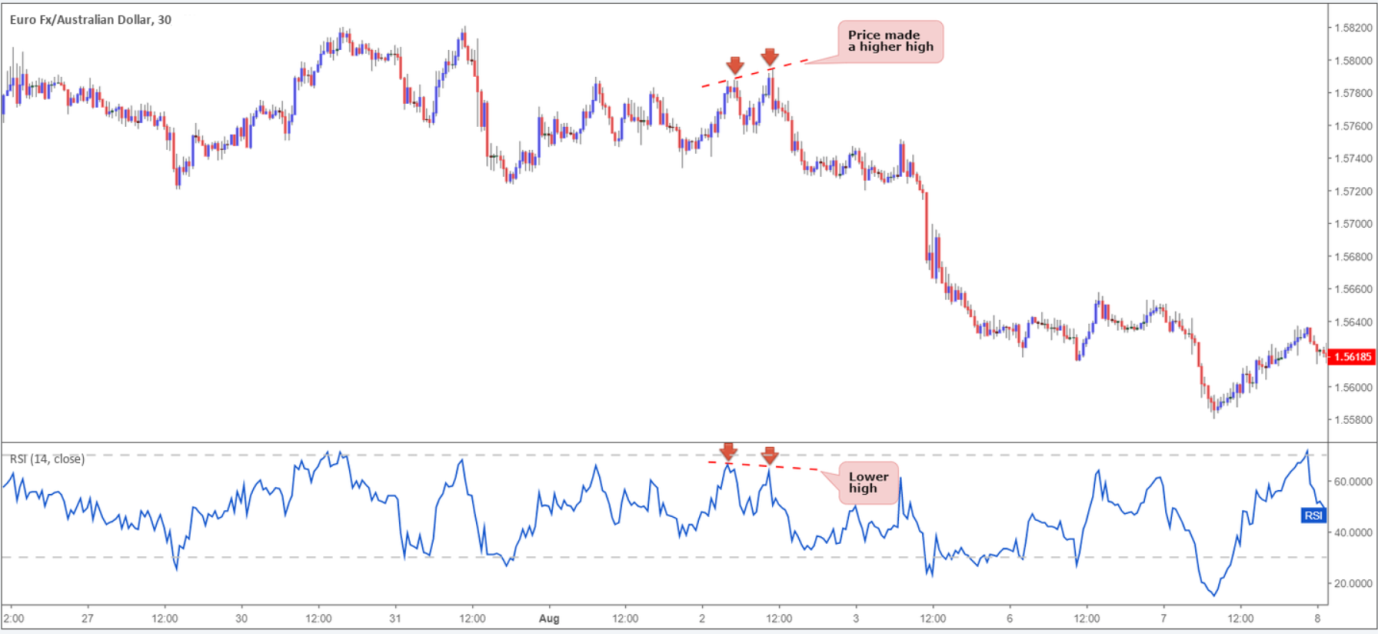
Divergence signals can offer an effective edge on the price chart, enabling traders to spot a potentially weakening/strengthening market.
Divergences are visible across all timeframes. For the best results, however, divergence observed on higher timeframes tends to suggest higher-probability signals.
RSI centre line:
The centre line of most oscillators is often overlooked. Found in the middle of the range at 50, this barrier is in place to discern early shifts in the underlying price trend. A push above 50 portends a strong immediate trend, whereas a move below 50 indicates an immediate bearish trend.
RSI patterns:
The RSI EMA has the ability to formulate patterns that precede price action. Trend lines, support and resistance, double bottoms and tops are just some of the technical formations to keep a watchful eye on.
By way of an example, the EUR/AUD M30 chart shown below was, at the time, compressed within a mild ascending channel pattern, with traders likely expecting its borders to hold.
The large bearish candle (point 1) shows strength to the downside, though price had yet to penetrate the channel support. Yet, on the RSI the indicator pierced beneath trend line support (point 2), providing an early signal price action may continue to press lower and eventually break the price chart’s channel support, which it did. In addition, there was also an opportunity to enter short at point 3 at the retest of the recently broken channel support (now acting resistance), given the RSI was also chalking up a similar retest play around the underside of its trend line support-turned resistance at point 4.
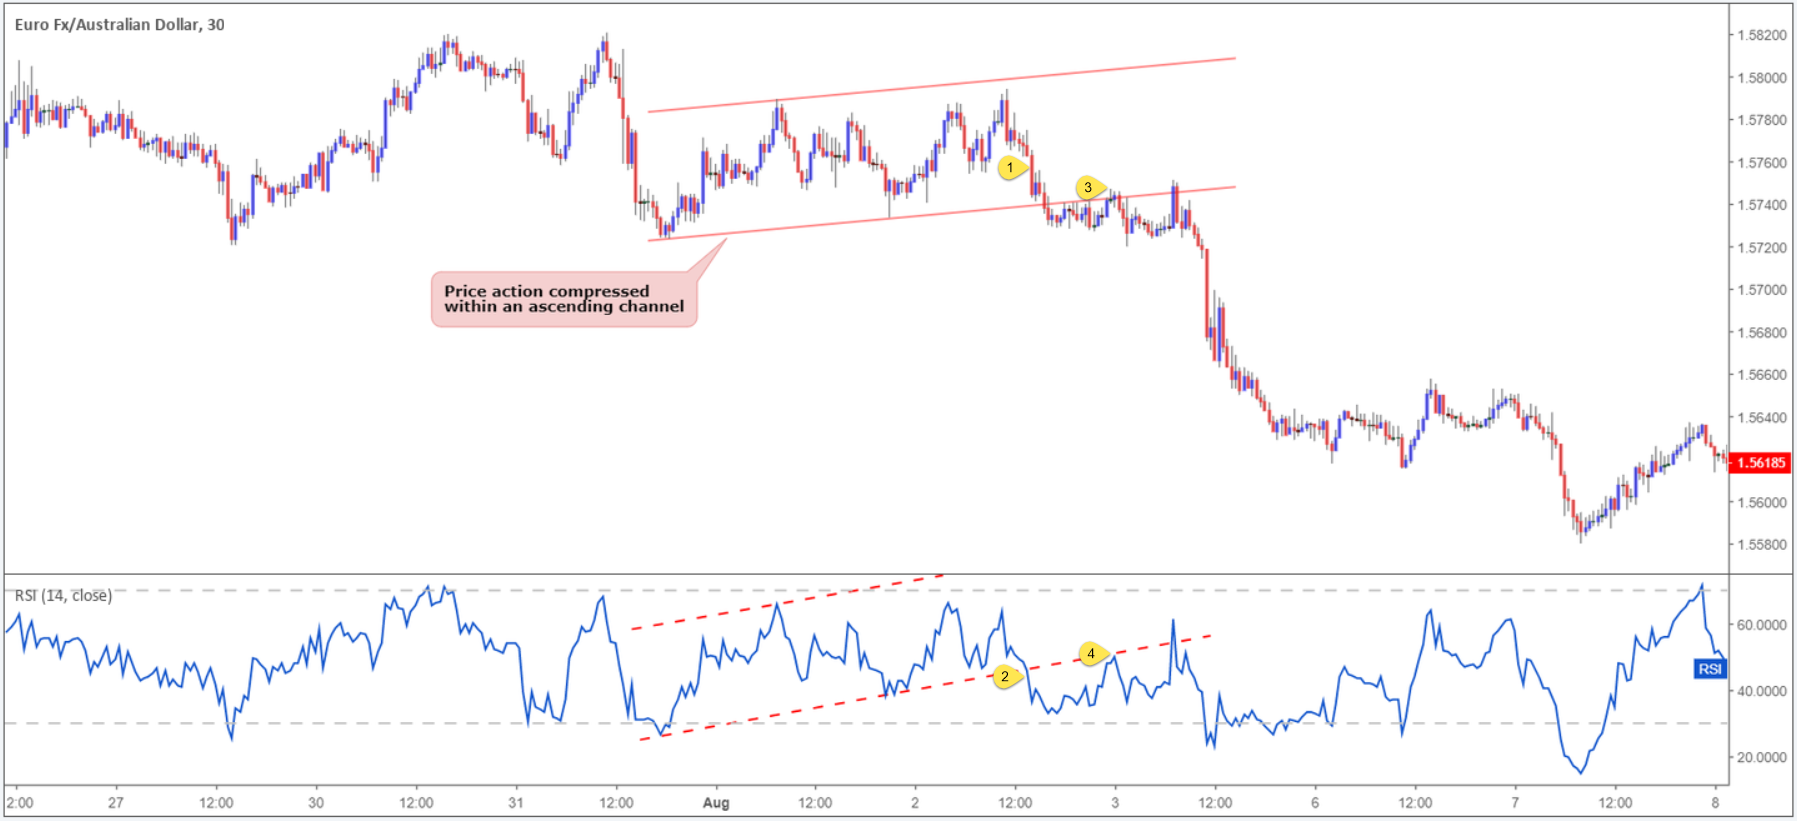
The chart, although reasonably simple, demonstrates the effectiveness of combining a price action pattern with the tools offered through the RSI indicator.
A final point to consider here is there is absolutely no need for the RSI pattern and chart pattern to emulate each other: In other words, the RSI pattern could form a trend line support, while price action trades from a demand zone.
Does the RSI show strength?
It shows a mathematical calculation of strength.
Although the RSI certainly has its place in a technician’s toolbox, trading it in isolation is challenging. If trading could be boiled down to following an indicator’s movement, there’d be a lot more traders that are successful.
Combining the power of the RSI along with additional technical tools such as supply and demand, support and resistance, trend lines or moving averages is certainly a viable option. There are a number of technical indicators that complement RSI movement.
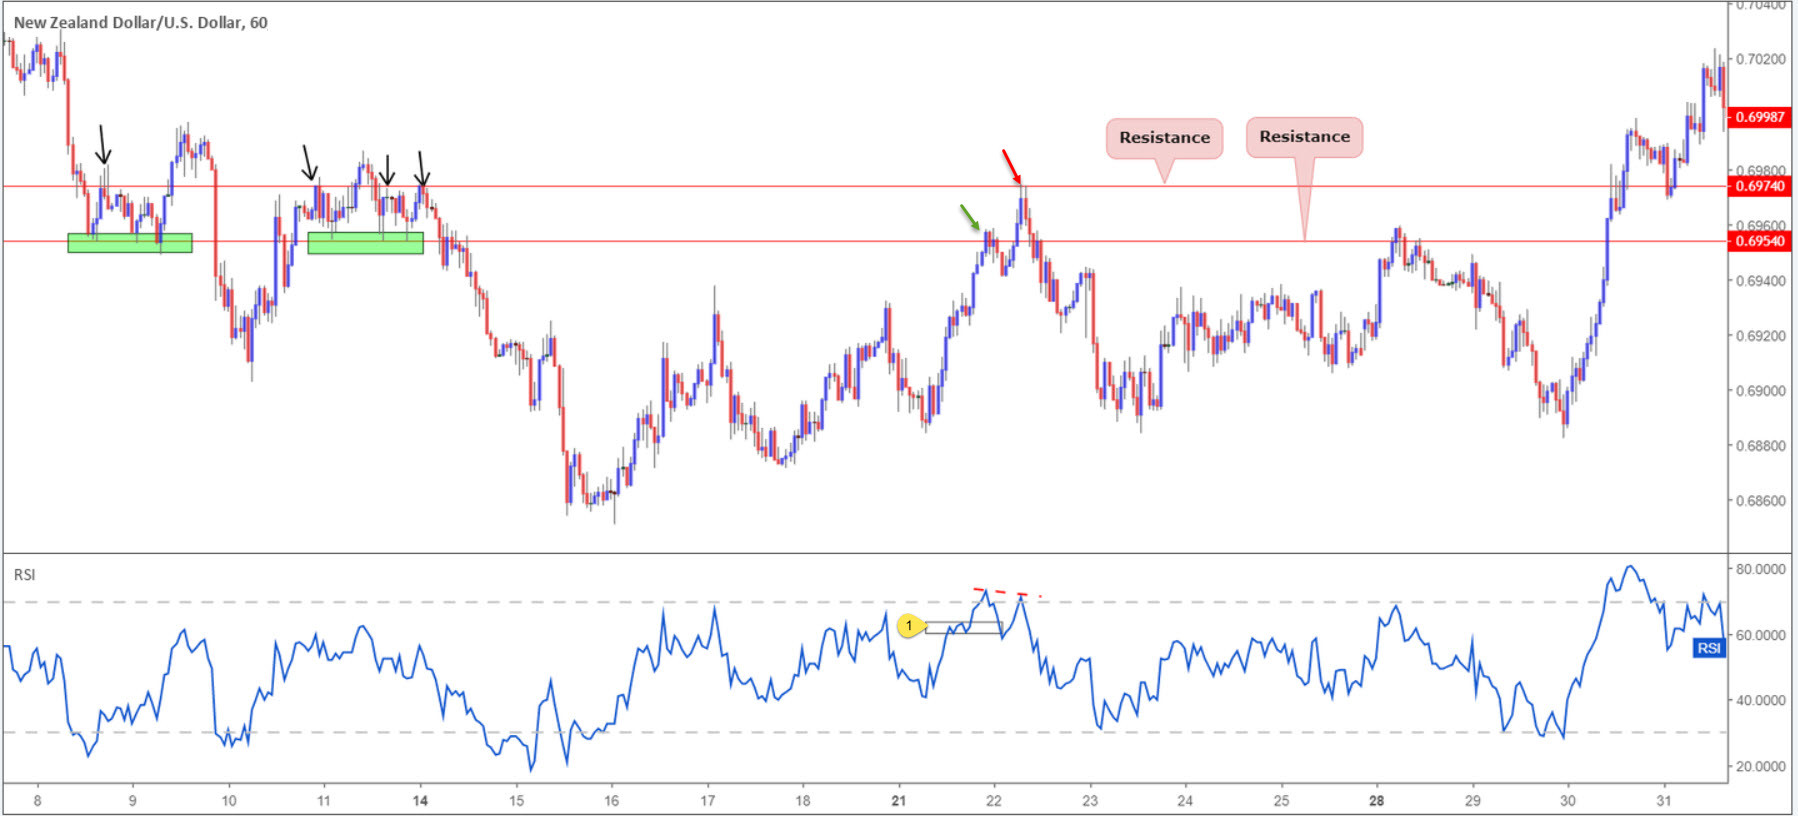
As an example, check out the NZD/USD M30 price chart depicted below. Two resistance levels stand out: 0.6974 and 0.6954 (red/green arrows). Both are of equal weighting as far as resistance levels go, though the upper barrier boasted additional confluence by way of an RSI bearish (regular) divergence signal within overbought territory. What’s more, the RSI engulfed a demand area (point 1) prior to forming the divergence signal. As a result of this, not only did we have a solid resistance level in play on the candles, the RSI exhibited a clear indication this market was likely weakening.
Final thoughts
The best form of technical analysis will always be what suits YOUR trading style and personality.
The RSI momentum indicator, as demonstrated in this article, has a multitude of uses which could benefit your trading.


