
Technical analysis contains numerous indicators, many of which traders use daily in the financial markets. Few, however, attain the popularity of the Moving Average Convergence Divergence (MACD).
Developed in the late 1970s by a gentleman who goes by the name of Gerald Appel, the MACD is primarily defined as a price momentum oscillator, although often labelled as a trend indicator. This is due to the MACD using momentum calculated as the difference between two exponential moving averages (EMA), fluctuating above and below a zero value. What’s more, unlike the relative strength index (RSI), the MACD is unbounded.
Applying the MACD effectively requires the understanding of its functions, applications and limitations.
Breaking down the MACD
At first glance, the MACD’s visually appealing canvas is immediately apparent.
Traditionally, to form the MACD, a 26-period EMA is subtracted from a 12-period EMA, though these parameters are adjustable for shorter and longer timeframes. This calculation results in a value that oscillates above/below a zero line. The MACD calculation is further smoothed to provide a signal line – a 9-day exponential smoothing of the MACD, used to provide trading recommendations.
A variation of the moving average crossover system, the MACD advances in an uptrend and declines in a downtrend. A positive MACD value indicates the average price during the past 12 periods exceeds the average price over the past 26 periods.
Figure 1.1A shows the daily chart of crude oil with the MACD indicator applied. The MACD denotes the blue EMA, while the orange EMA is the signal line. In addition to this, a histogram forms around the zero value, calculated by subtracting the slower signal line from the MACD.
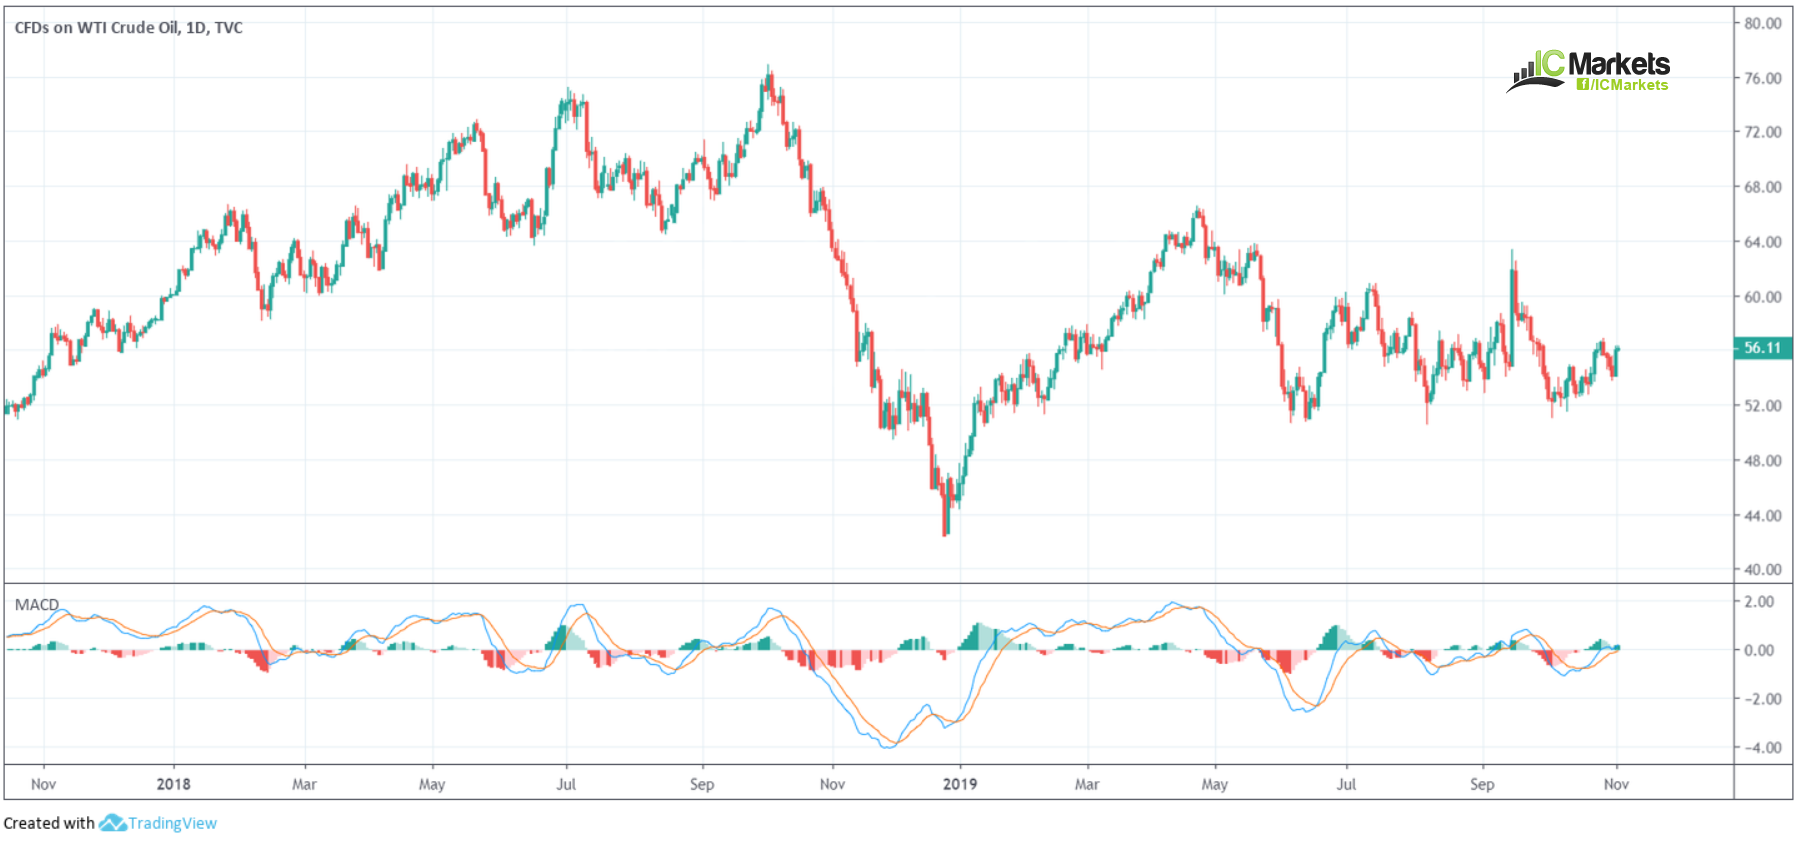
(FIGURE 1.1A)
Benefitting from the MACD
A common use of the MACD is as a trend indicator. Traders buy when the MACD line (the faster combination) crosses above the signal line (slower formation), and sell when the MACD line crosses beneath the signal line – a MACD crossover. Figure 1.1B demonstrates a number of crossings, some of which were profitable and others not so much.
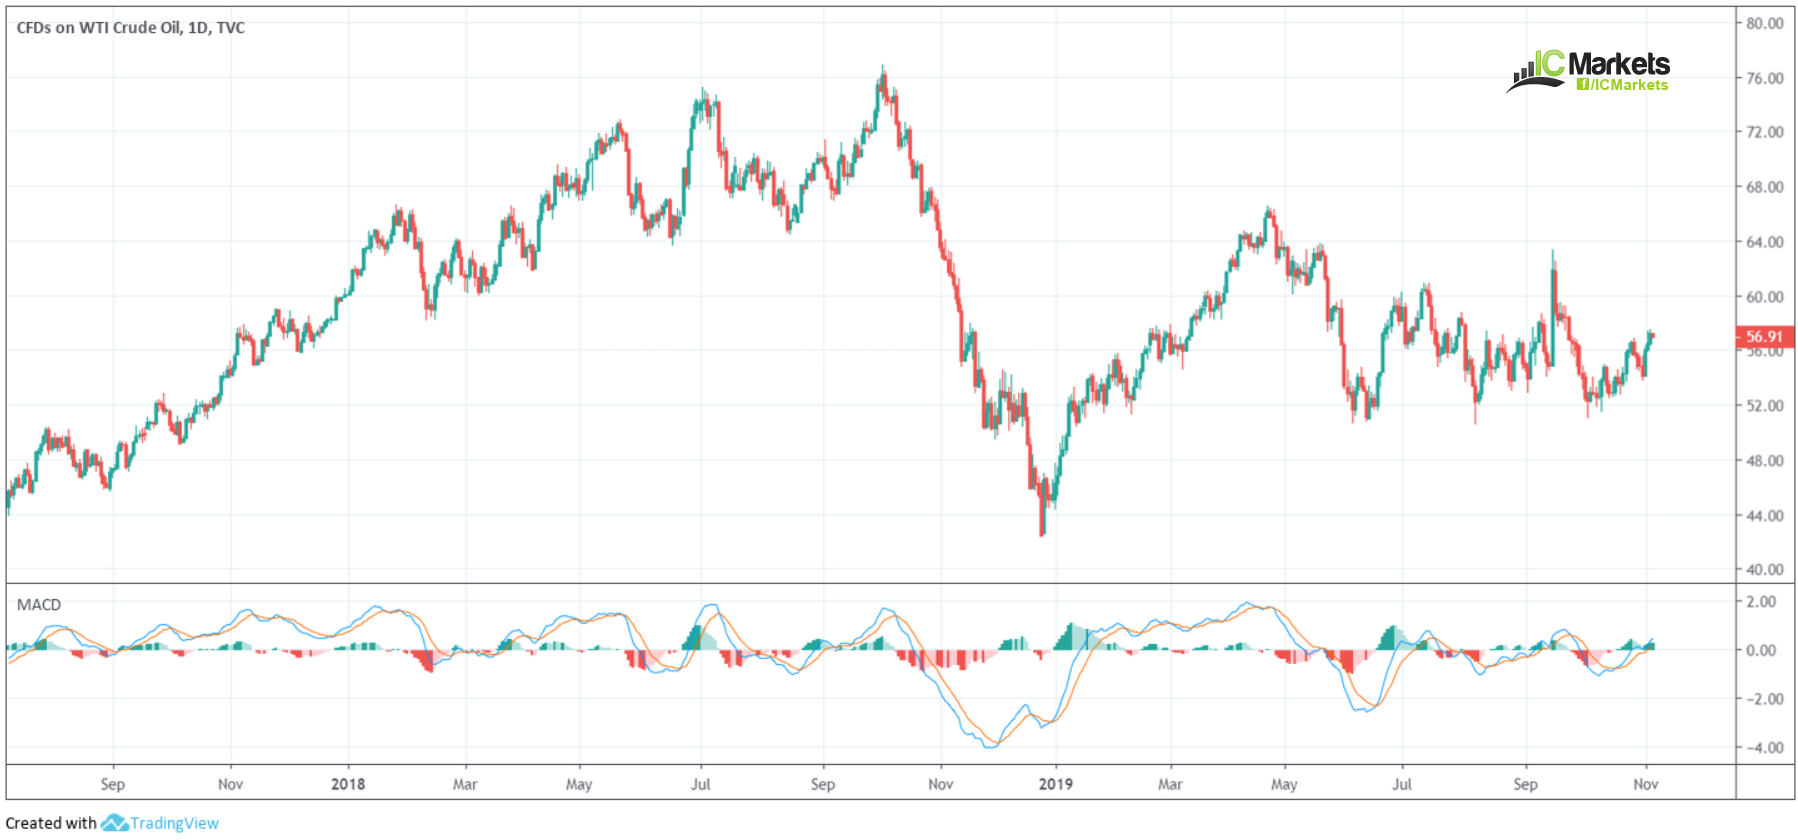
(FIGURE 1.1B)
Thresholds
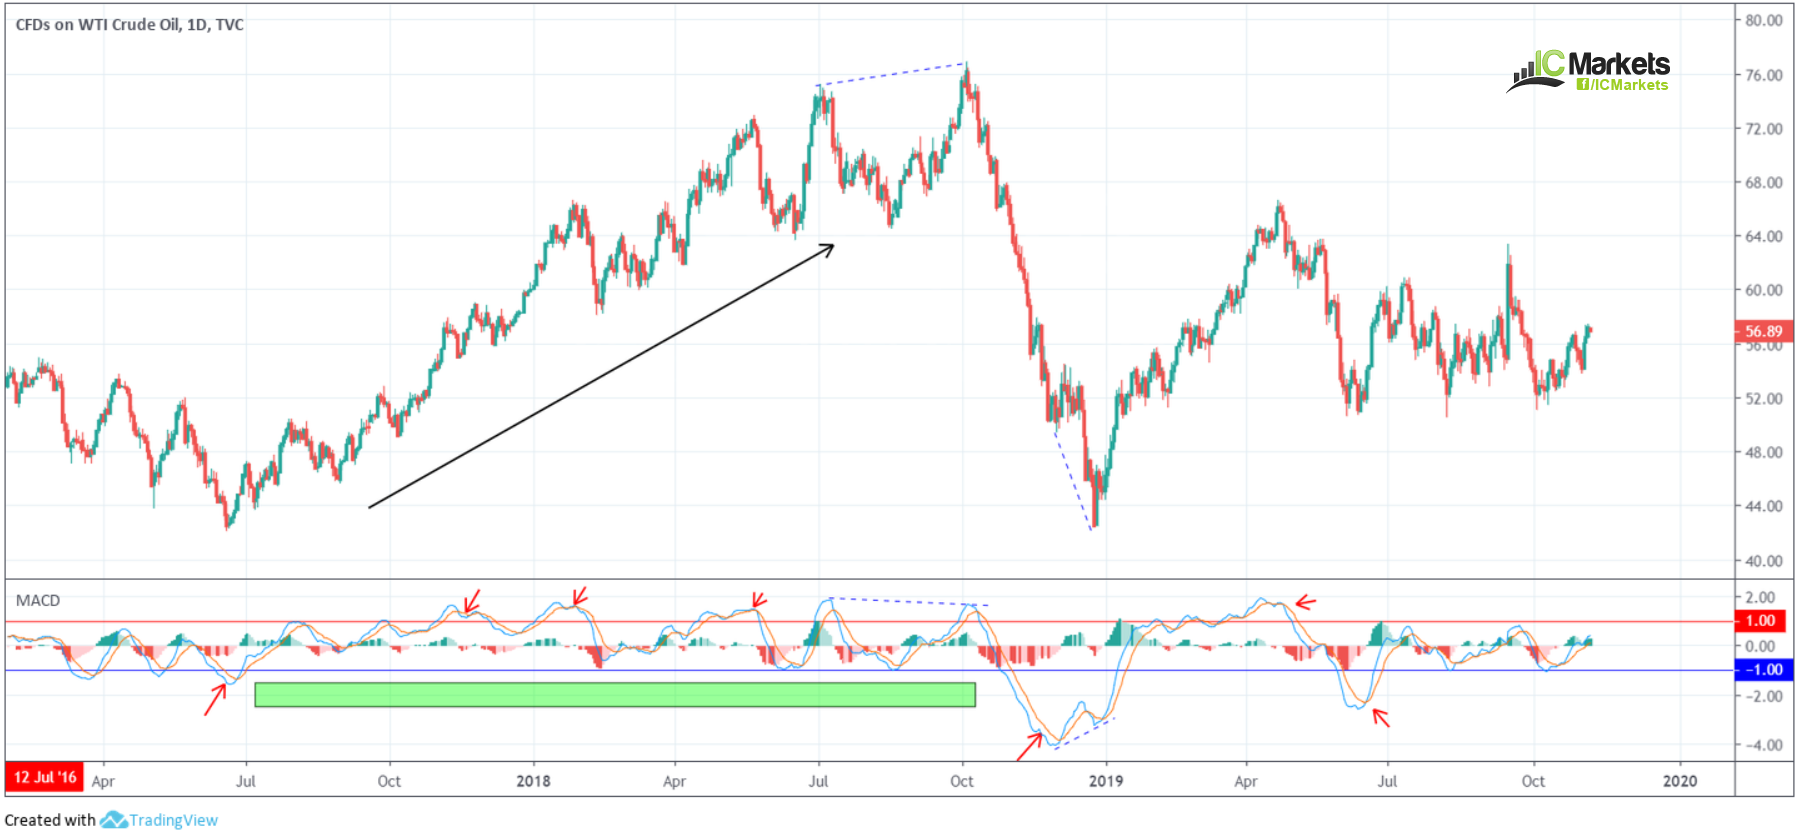
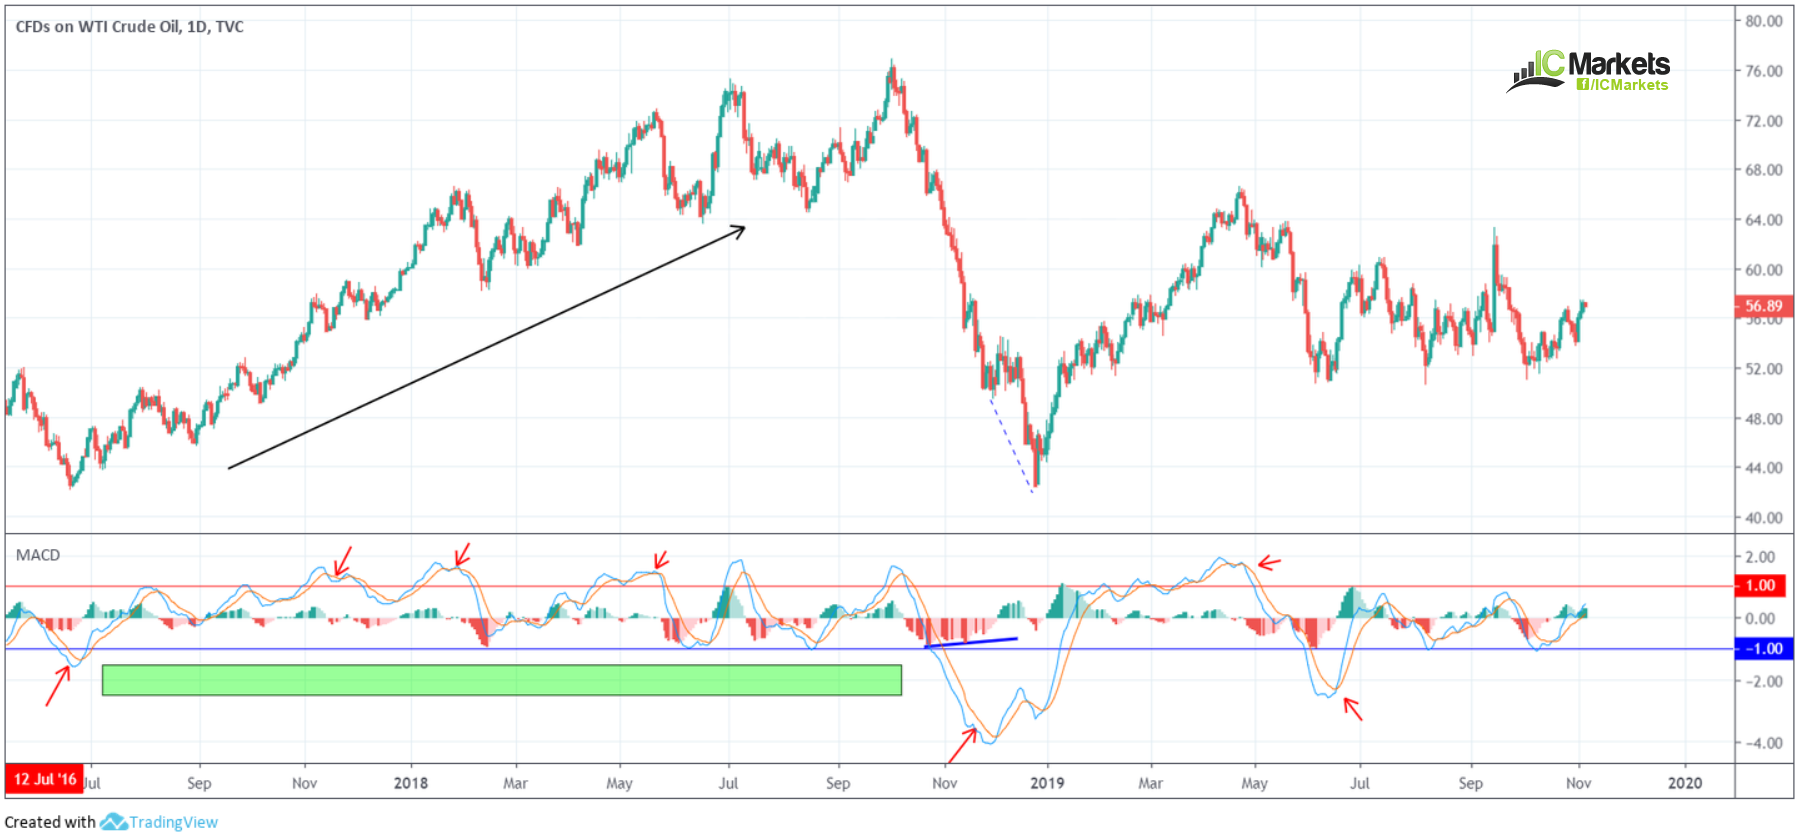
In order to help circumvent the issue of false (crossover) signals, it is essential to be selective. Although the MACD indicator is traditionally an unbounded configuration, traders can add overbought and oversold thresholds. A simple technique used to set thresholds is by observing historically high and low momentum values. Figure 1.1C shows a minimised daily WTI chart, which when analysed from July 2016, displays the average threshold at approximately 1.00. Mostly, though, traders use 2.00 on either side.
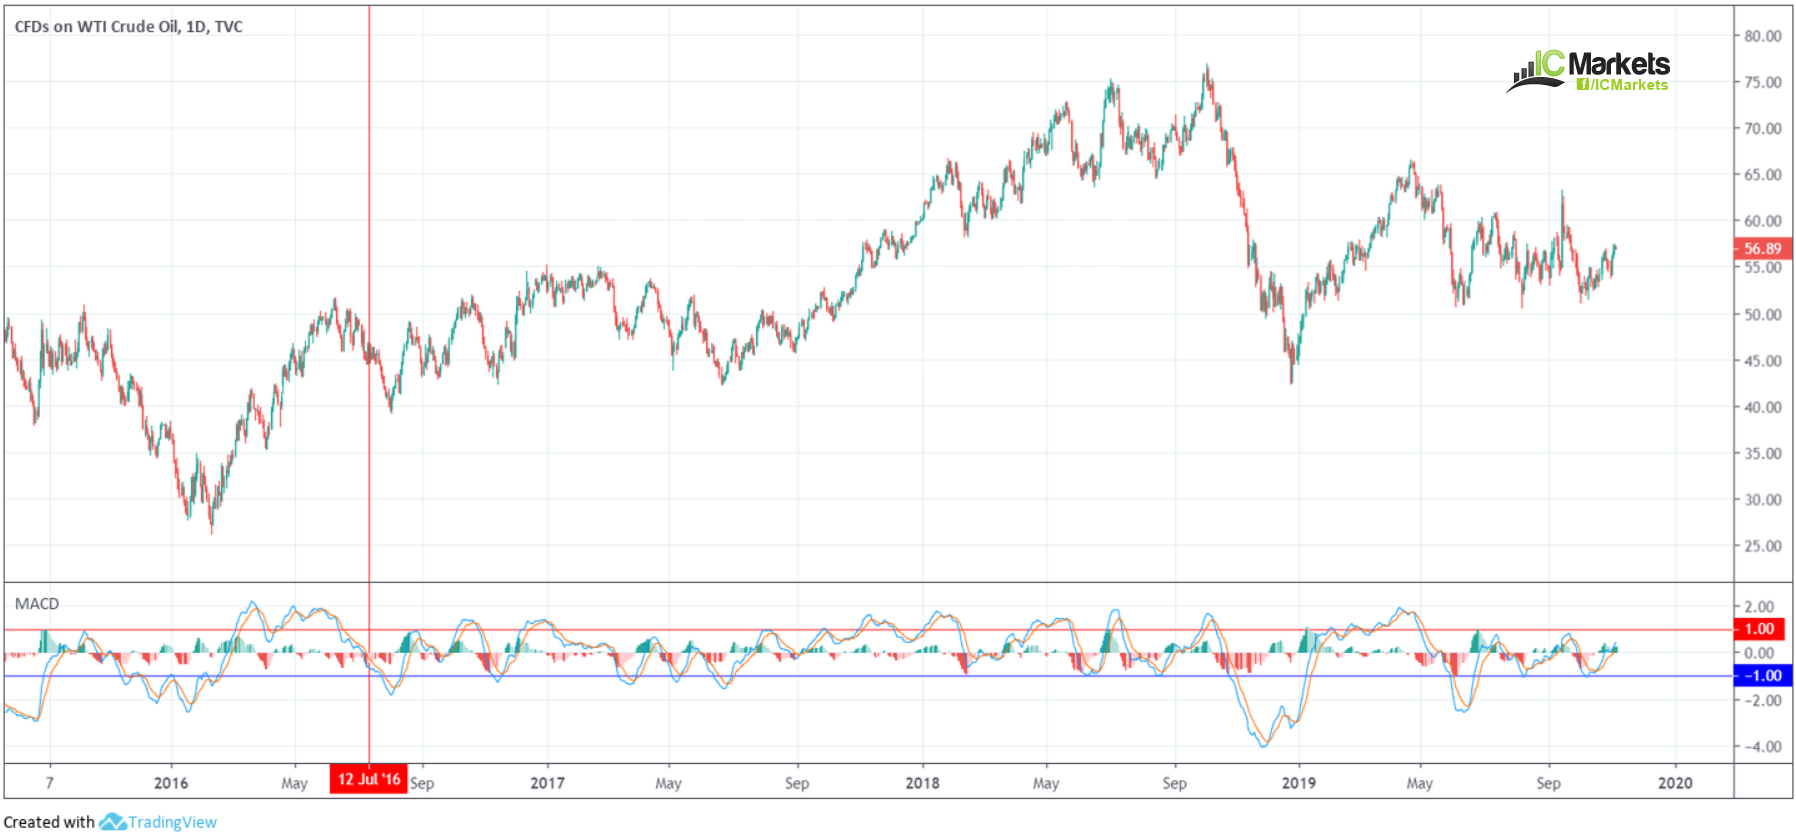
(FIGURE 1.1C)
By applying the noted thresholds, traders can focus efforts outside of these boundaries, searching for selling opportunities when both the MACD and signal line are above 1.00 and buying opportunities when both MACD and the signal line are below -1.00.
Figure 1.1D is an interesting chart. The period between July 2017 and October 2018 (green) had WTI entrenched within an incredibly strong uptrend. Buying pressure was so strong, the MACD/signal line were unable to cross beneath -1.00 for a buy. Had you taken the buy signal formed in June (the first red arrow), nonetheless, the gains accumulated from the up move were immense, with the first sign of selling pressure not visible until mid-November 2017. Knowing the trend was strong at that point, though, the MACD crossing below the signal line was simply a warning, not necessarily a reversal signal. Traders looking to buy and sell MACD extremes generally trade with the trend.
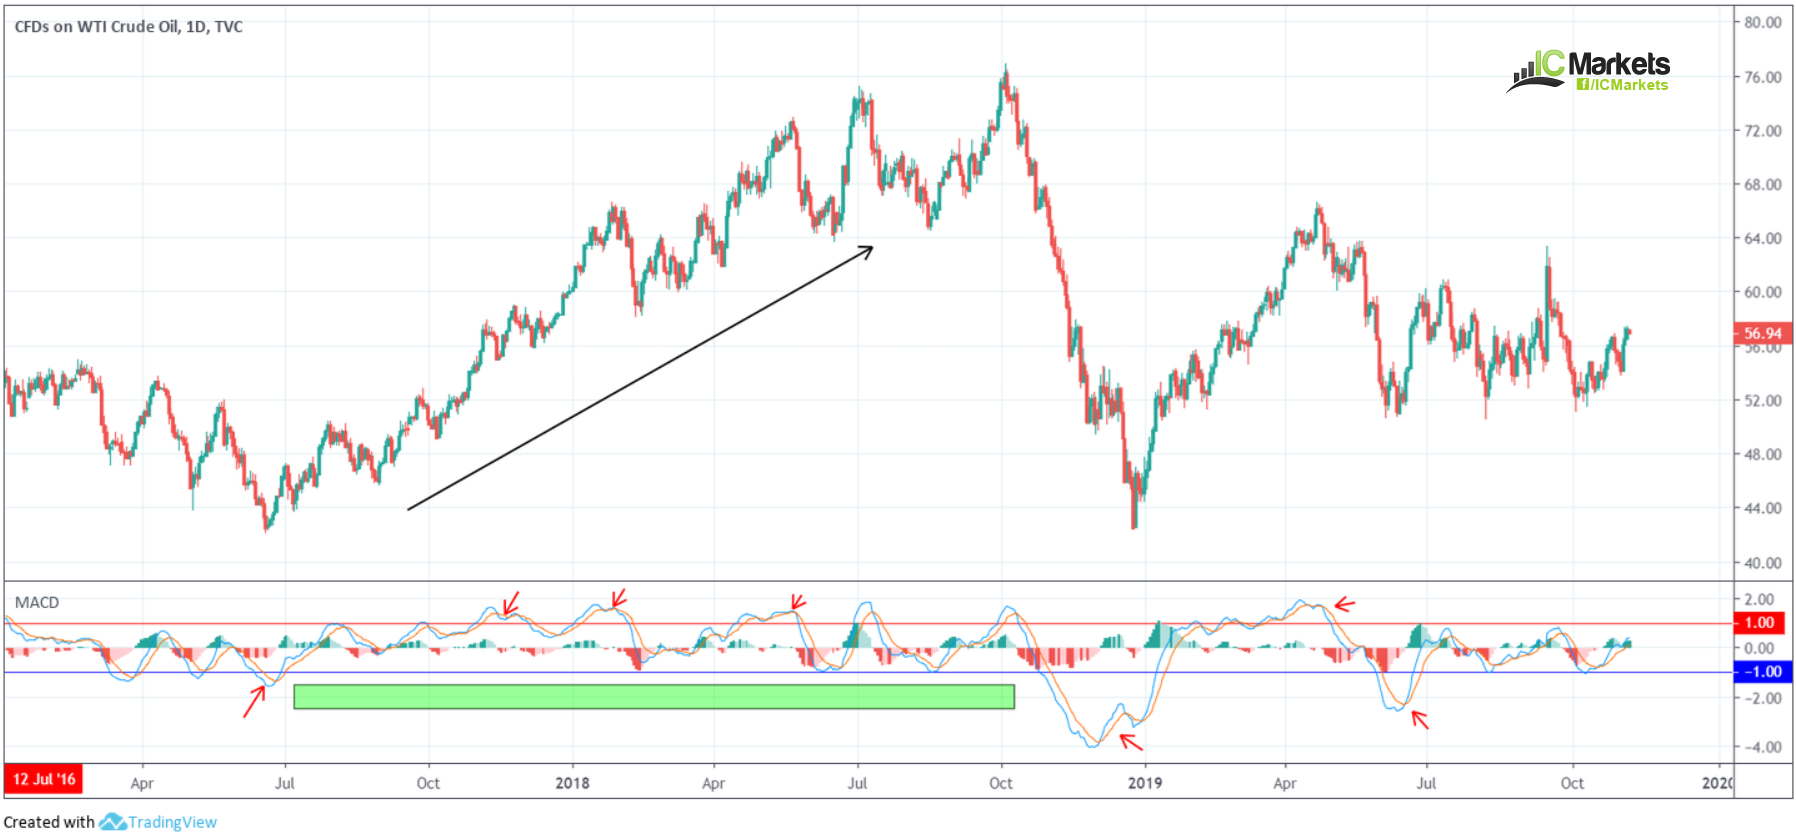
(FIGURE 1.1D)
Divergences
A popular addition to the MACD indicator is the use of divergences, which applies to many oscillators. Divergence occurs when underlying price movement prints a fresh high/low that is not confirmed by the MACD.
Below are two examples of divergences seen regularly in the market (blue signifies price action and red represents MACD movement):
Divergence signals can offer an effective edge on the price chart, enabling traders to spot a potentially weakening/strengthening market. Divergences are visible across all timeframes. For the best results, however, divergence observed on higher timeframes tends to suggest higher-probability signals.
Figure 1.1E demonstrates (regular) bearish divergence and (regular) bullish divergence. This, alongside the indicator trading outside the pre-determined thresholds, as well as forming a MACD crossover signal, certainly adds weight to price moving favourably.
(FIGURE 1.1E)
The Histogram
A histogram is often applied to the MACD indicator. Developed by Thomas Aspray in 1986, the MACD-Histogram represents the difference between MACD and its 9-day EMA, the signal line. The histogram is positive when the MACD is above the signal line and negative when below. Aspray developed the MACD-Histogram to anticipate signal line crossovers.
The MACD-Histogram anticipates signal line crossovers in the MACD by forming bullish and bearish divergences. These divergences signal the MACD is converging on its signal line, suggesting a cross is possibly in store. See figure 1.1F for a visual representation – blue line).
(FIGURE 1.1F)
Adjustment and Limitations
Traditionally, as highlighted above, the MACD indicator forms by subtracting the difference between a 26-day and 12-day EMA. The signal line is a 9-period EMA of the of the MACD line. The different periods that can be applied is almost endless, making it a somewhat subjective indicator. For example, increasing the signal line’s periods reduces the number of crossover signals. While this helps avoid whipsaws, the drawback is the crossover forms later.
Figure 1.1G shows a traditional MACD indicator using a 12-26-9 formation applied to the middle pane of the chart, while below there’s a 20-40-15 calculation. Although reasonably similar, the latter offers a smoother ride with not as many whipsaws. The trade-off, though, is the crossover signal forms later, getting you in at a less favourable price.
Since the MACD is a lagging indicator – its calculation forms by way of moving average calculations – it is somewhat slow to register sudden shifts in the market. The lag increases/decreases dependent on the lookback periods in the calculation.
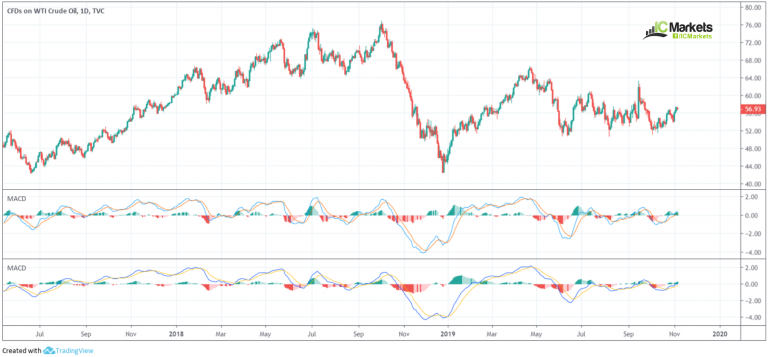
(FIGURE 1.1G)
The bottom line
The MACD momentum indicator, as demonstrated in this article, has a multitude of uses which could benefit your trading. Trading it in isolation, however, is not recommended. Working it alongside additional technical tools has proven useful. This could be something as simple as merging the indicator with basic trend line studies, for example. A trading strategy that follows support and resistance is another option, using the MACD signal as confirmation.
Notes:
Appel, Gerald (2005). Technical Analysis Power Tools for Active Investors. Financial Times Prentice Hall.


