
An Italian mathematician who went by the name of Leonardo Pisano, or Leonardo of Pisa, was perhaps the most talented western mathematician of the middle ages. Better known by his nickname ‘Fibonacci’, he was the gentleman who discovered an interesting relationship between nature and numbers.
0, 1, 1, 2, 3, 5, 8, 13, 21, 34… Look familiar?
This is a Fibonacci sequence. The next number in the series is found by adding the two numbers before it. For example, number 2 is found by adding 1+1. 3 is found by adding 1+2 and 5 is found by adding 2+3 and so on and so forth. To that end, the next number in the sequence shown above is 21+34 = 55.
So, what does this have to do with trading the financial markets? Well, put simply, we can use these levels to find support and resistance…
Fibonacci retracements
Arguably Fib’ retracement levels are the most heavily used in all of the Fibonacci readings. The most popular Fib’ retracement values are 61.8%, 50.0% and 38.2%. In saying this though, the 50.0% level does not have anything to do with Fibonacci numbers. Traders, however, still use this value because markets have a tendency to reverse after retracing 50.0% of the previous move.
Fib’ retracement levels are, in our opinion, far easier to spot in a trending environment. That is, of course, not to say that they cannot be used in ranging markets.
The general idea is to buy on a retracement at a Fib’ support level when the market is trending north, and to sell on a retracement at a Fib’ resistance level when the market is trending south.
In order to draw Fib’ retracement levels, we need to find a significant swing low and swing high. As they say, a picture is worth a 1000 words, so let’s get out a chart!
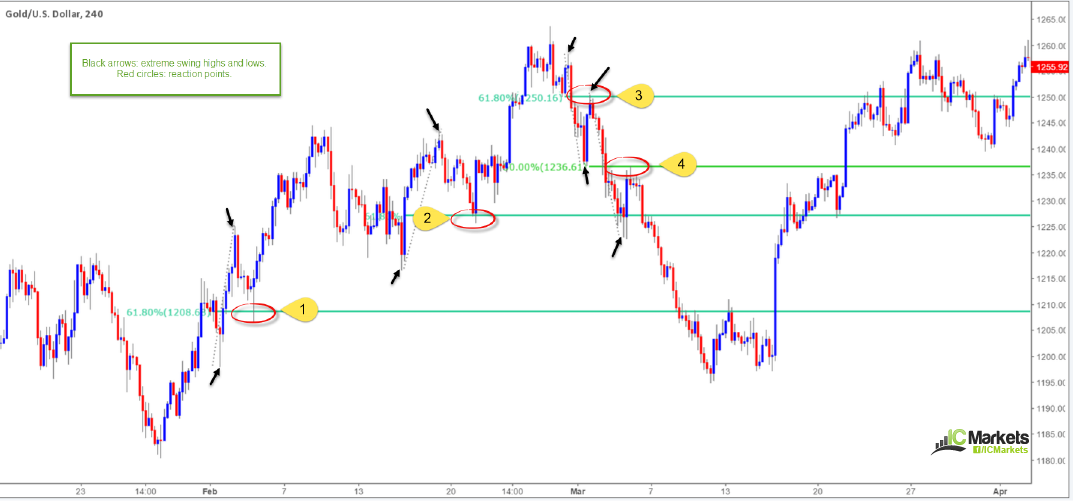
On the chart above, example 1 shows a clear swing low and high was identified (marked by the two black arrows). Price, as you can see, retraced relatively quickly and touched base with the 61.8% Fib’ retracement support level, which allowed buyers to enter the market and lift the unit higher.
Examples 2, 3 and 4 are near-mirror images. The only real difference is that we’re trading Fib’ resistances in examples 3 and 4, and also the 50.0% retracement level came into play in example 4.
Fibonacci extension
The Fib’ extension tool, which should be available on most trading platforms, can help determine both profit targets and potential areas of support/resistance in the market. Through experience and a truckload of back testing, here is how our team exploit this tool in our trading.
Firstly though, to draw the Fib’ extension levels we, again, look for a significant swing high and swing low.
To reveal the Fib’ extensions, after point 2 is in motion, simply drag the cursor back down/up to point 1, which we’ll label as point 3 for ease of reference here. Also of note, we only utilize the 127.2% (the square root of 161.8%) and 161.8% value since these levels proved to be the most reliable in our testing. Around 60% in fact.
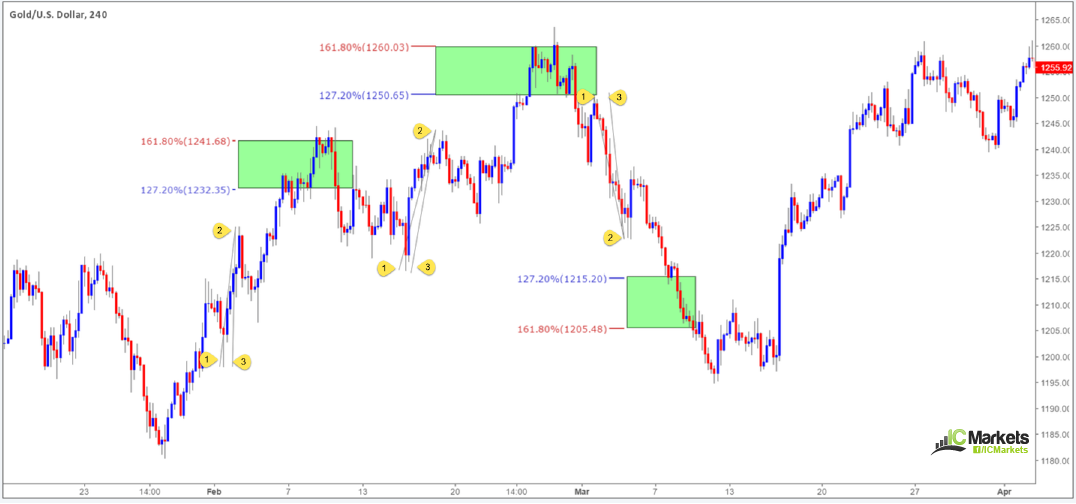
On the chart above, the first 2 examples eventually found a ceiling of resistance between the 127.2%/161.8% Fib’ extension levels. The final example, however, failed to offer any type of support.
Additional points to consider…
- Fib’ levels work well when they unite with structure i.e. supply and demand, support and resistance and psychological numbers.
- Fib’ levels are NOT the holy grail. Trading them expecting each trade to win is going to end in frustration!
- Fib’ clusters are also very attractive. We’ll try to touch on this techniques in future articles.
- The two Fib’ values 61.8 and 1.618 are known as the golden ratio or golden mean. It is said that the proportions are somewhat pleasing to the human eye, and appears throughout biology, art, music and architecture. Both numbers are looked highly upon by market speculators.


