

Live Comments
New Zealand Retail Sales Fall -0.35% Q/Q as Fuel Price Surge Masks Weaker Volumes
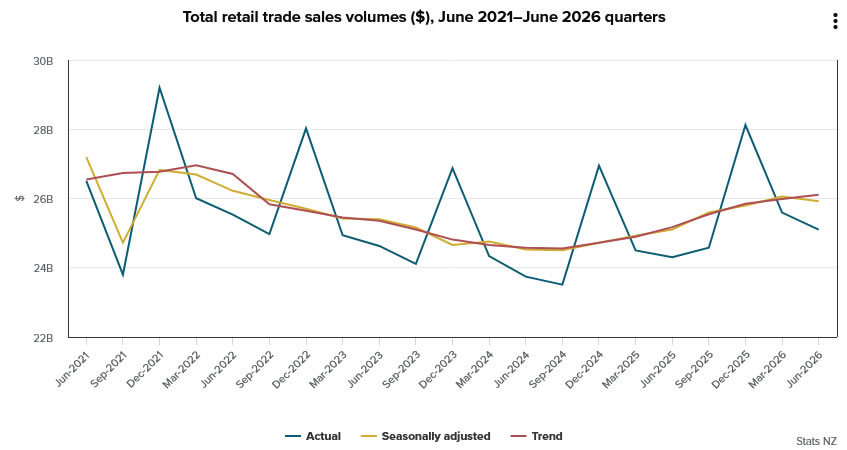
New Zealand retail sales volumes fell -0.5% q/q in Q2, reversing a revised 1.0% rise in Q1 and missing expectations for a 0.1% increase. Excluding autos, however, sales rose 0.7%, slowing from a revised 1.1% but comfortably beating consensus of 0.3%. Eight of 15 industries recorded lower sales volumes, pointing to a mixed rather than uniformly weak quarter.
Fuel retailing was by far the largest drag, with volumes plunging -13%, while accommodation fell -8.0%, food and beverage services dropped -2.8%, and motor vehicle and parts retailing declined -2.3%. Electrical and electronic goods retailing provided a notable offset, rising 9.2%. Weakness therefore extended beyond autos, but sharp fall in fuel volumes had an outsized impact on headline result.
Price effects created a striking contrast with volume data. Seasonally adjusted retail sales values rose 0.9% q/q to NZD 33bn, even as real volumes contracted. Fuel retailing values surged 12% despite -13% fall in volumes, with Stats NZ attributing increase to higher fuel prices. Divergence suggests households paid considerably more for fuel while buying less, leaving headline nominal spending looking much firmer than underlying consumption volumes.
Data Summary
| Indicator | Actual | Expected | Previous |
|---|---|---|---|
| Retail Sales q/q Q2 | -0.5% | +0.1% | +1.0% |
| Retail Sales ex Autos q/q Q2 | +0.7% | +0.3% | +1.1% |
Key Takeaways
- New Zealand retail sales volumes fell 0.5% q/q in Q2, reversing 1.0% growth in Q1 and missing expectations for a 0.1% increase.
- Underlying picture was firmer than headline suggested, with ex-auto sales rising 0.7%, beating 0.3% consensus despite slowing from 1.1%.
- Fuel was biggest drag on real activity, with sales volumes plunging 13%, while accommodation fell 8.0%, food and beverage services declined 2.8%, and motor vehicle and parts sales dropped 2.3%.
- Higher prices sharply distorted nominal figures. Fuel retailing values jumped 12% even as volumes fell 13%, helping total retail sales values rise 0.9% q/q.
- Report therefore points to softer real consumption at headline level, but not broad-based spending weakness, with price effects—particularly fuel—masking decline in physical purchases.
US PMI Composite Hits 52-Month High as Services Drive August Acceleration
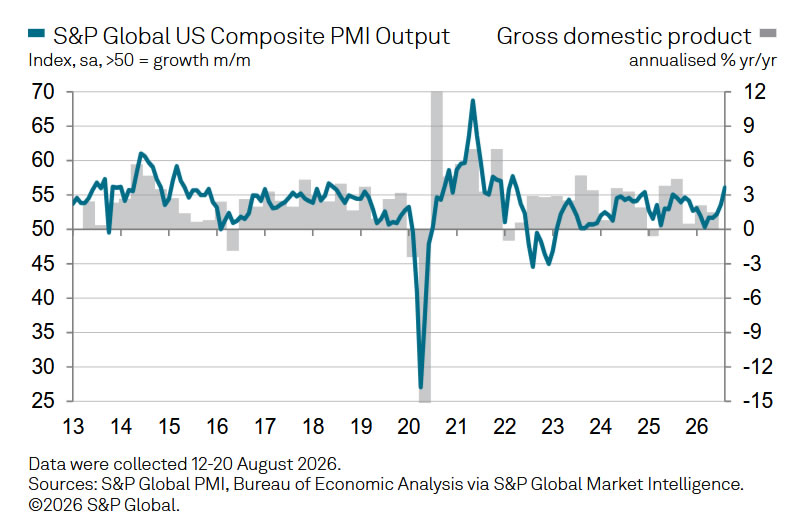
US private-sector growth accelerated sharply in August, with PMI Composite Output rising from 54.5 to 56.0, its highest in 52 months. PMI Services Business Activity climbed from 54.6 to 56.8, a 20-month high, becoming main driver of expansion. PMI Manufacturing eased from 53.9 to 53.2, while PMI Manufacturing Output dropped from 53.9 to 51.9, a 13-month low.
S&P Global said Q3 survey data are now consistent with annualized growth approaching 3.0%, up from 1.5% in Q2. Employment also strengthened as business confidence improved. Manufacturing, however, lost momentum as precautionary inventory building faded and supply delays constrained production. Those delays remained among most severe seen over past four years, with Middle East disruption and energy prices still key concerns.
Inflation pressure eased somewhat but remained elevated, leaving Fed with a mixed but still firm backdrop. Stronger services activity and renewed hiring point to resilient demand, while weaker factory output shows expansion is becoming more dependent on consumers and financial services. With price pressures still vulnerable to another energy shock, August PMI does little to strengthen case for an easier policy stance.
Data Summary
| Component | Current | Previous | Trend |
|---|---|---|---|
| PMI Composite Output | 56.0 | 54.5 | 52-month high |
| PMI Services Business Activity | 56.8 | 54.6 | 20-month high |
| PMI Manufacturing | 53.2 | 53.9 | 5-month low |
| PMI Manufacturing Output | 51.9 | 53.9 | 13-month low |
| Q3 GDP Signal | ~3.0% annualized | 1.5% Q2 | Stronger |
| Employment | — | — | Growth revived |
| Business Confidence | — | — | Improved |
| Input / Price Pressures | — | — | Easing but still elevated |
| Supply Delays | — | — | Among worst in four years |
Key Takeaways
- US PMI Composite Output rose from 54.5 to 56.0 in August, reaching its strongest level in more than four years.
- PMI Services Business Activity accelerated from 54.6 to 56.8, a 20-month high and clear driver of overall growth.
- PMI Manufacturing eased from 53.9 to 53.2, while PMI Manufacturing Output fell more sharply from 53.9 to 51.9.
- S&P Global said Q3 survey data point to annualized GDP growth approaching 3.0%, up from 1.5% in Q2.
- Employment growth revived as business confidence improved.
- Manufacturing lost momentum as precautionary stock building faded and supply delays constrained production.
- Supply-chain disruption remained severe, with Middle East conflict and energy prices still key risks.
- Price pressures eased but stayed elevated, leaving inflation vulnerable to another energy shock.
- For Fed, data point to resilient demand and stronger services activity, limiting scope for a rapid shift toward easier policy.
Canada Retail Sales Rise 0.6% as Core Spending Strengthens, but July Estimate Warns of Pullback
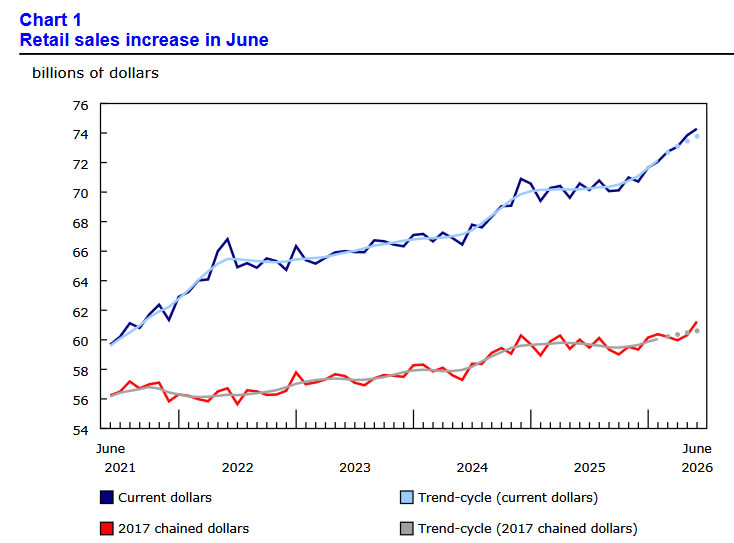
Canada retail sales rose 0.6% m/m in June to CAD 74.3bn, beating expectations for 0.4% and following a revised 1.1% gain in May. Sales increased in seven of nine subsectors. More importantly, core retail sales excluding gasoline and motor vehicles rose 1.2%, extending their advance for a second month. In volume terms, total retail sales increased 1.5%, showing that June’s improvement reflected a meaningful rise in real spending.
General merchandise retailers led core growth with a 2.7% increase. Clothing, footwear, jewelry and related retailers gained 3.1%. Motor vehicle and parts dealers rose 1.0% for a third consecutive month, driven by new-car sales. Food and beverage retailers slipped 0.4%. Gasoline-station receipts fell 4.1%, but volumes increased 4.2%, highlighting the impact of lower fuel prices on nominal sales.
The broader picture is less straightforward heading into Q3. Retail sales rose 2.2% in Q2, though volumes increased a more modest 0.4%. Statistics Canada’s advance estimate points to a -0.8% decline in July, suggesting June’s strength may not have carried forward. The early estimate is based on responses from only 56.5% of surveyed companies and is subject to revision, but it nevertheless tempers the strong June report and points to a potentially softer start to Q3.
Data Summary
| Indicator | Actual | Expected | Previous |
|---|---|---|---|
| Retail Sales m/m | 0.6% | 0.4% | 1.1% |
| Retail Sales ex Autos m/m | 0.5% | 0.2% | 1.2% |
| Core Retail Sales m/m* | 1.2% | — | — |
| Retail Sales Volume m/m | 1.5% | — | — |
| Retail Sales q/q | 2.2% | — | — |
| Retail Sales Volume q/q | 0.4% | — | — |
| July Advance Retail Sales Estimate m/m | -0.8% | — | 0.6% |
*Core retail sales exclude gasoline stations and fuel vendors, and motor vehicle and parts dealers.
Key Takeaways
- Canada retail sales rose 0.6% m/m in June, beating expectations for 0.4%, after May was revised higher to 1.1%.
- Retail sales excluding autos increased 0.5%, also beating the 0.2% forecast.
- Core retail sales rose a stronger 1.2%, extending gains for a second consecutive month.
- Real spending was particularly firm, with retail sales volumes jumping 1.5% m/m.
- General merchandise sales rose 2.7%, while clothing and related categories gained 3.1%.
- Motor vehicle and parts sales increased 1.0% for a third straight month.
- Gasoline-station receipts fell 4.1%, but volumes rose 4.2%, showing lower prices rather than weaker fuel demand drove the nominal decline.
- Retail sales increased 2.2% in Q2, but volumes rose a more moderate 0.4%.
- Statistics Canada’s advance estimate points to a 0.8% decline in July, warning that June strength may not have carried into Q3.
- July estimate is highly provisional, based on responses from 56.5% of surveyed companies, versus an average final response rate of 87.3%.