USDCAD Outlook
USD/CAD Daily Outlook
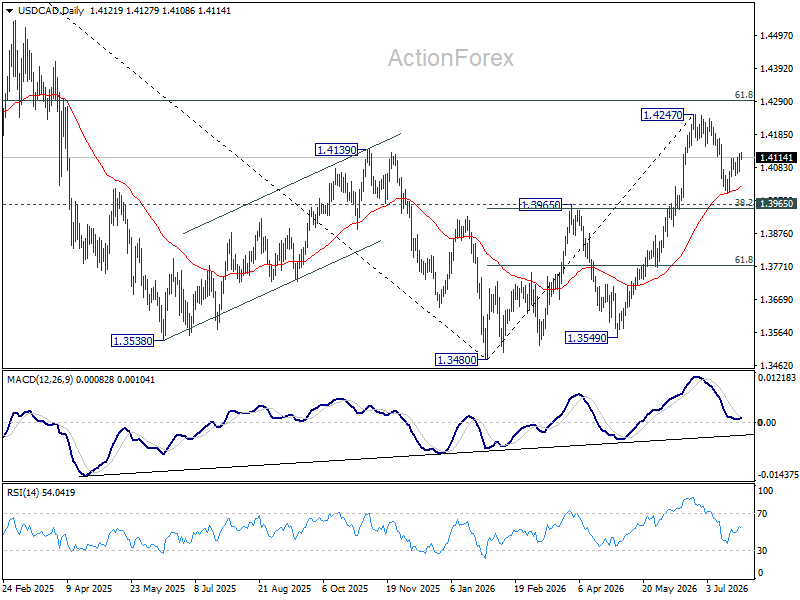
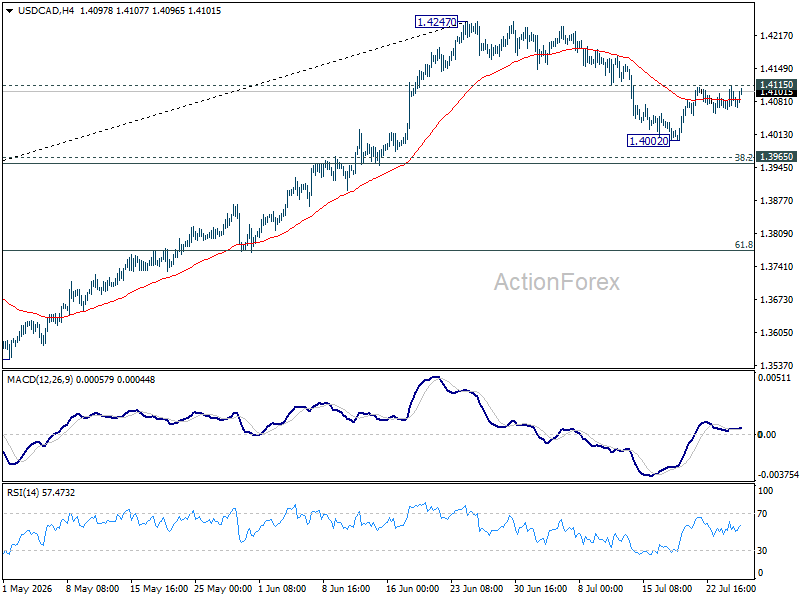
USD/CAD's breach of 1.4115 resistance suggests that corrective pullback from 1.4247 has already completed at 1.4002. Intraday bias is back on the upside for retesting 1.4247 first. In case of another fall, downside should be contained by 1.3965 cluster support (38.2% retracement of 1.3480 to 1.4247 at 1.3954 to bring rebound.
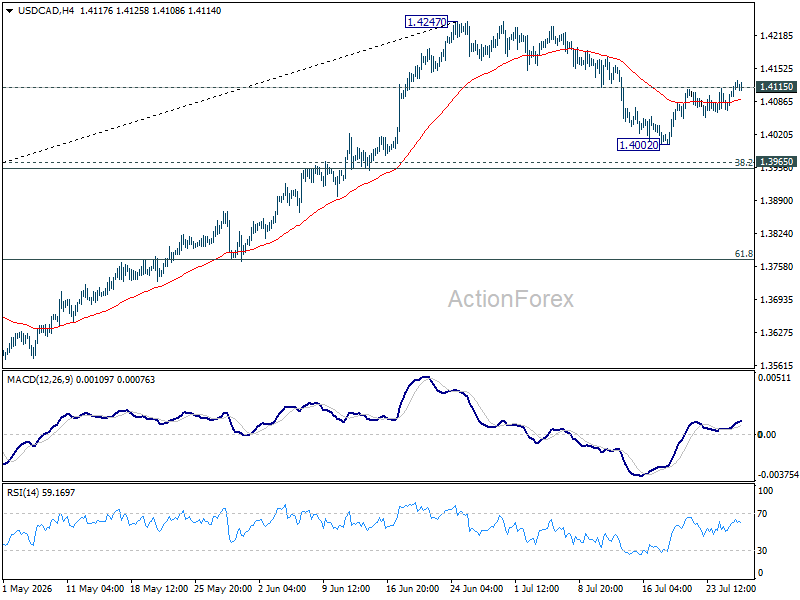
In the bigger picture, current development suggests that fall from 1.4791 has completed as a three wave correction to 1.3480. It's still early to judge if rise from there a corrective bounce, or resumption of the larger up trend from 1.2005 (2021 low). But in either case, retest of 1.4791 high should be seen next.
USD/CAD Daily Outlook
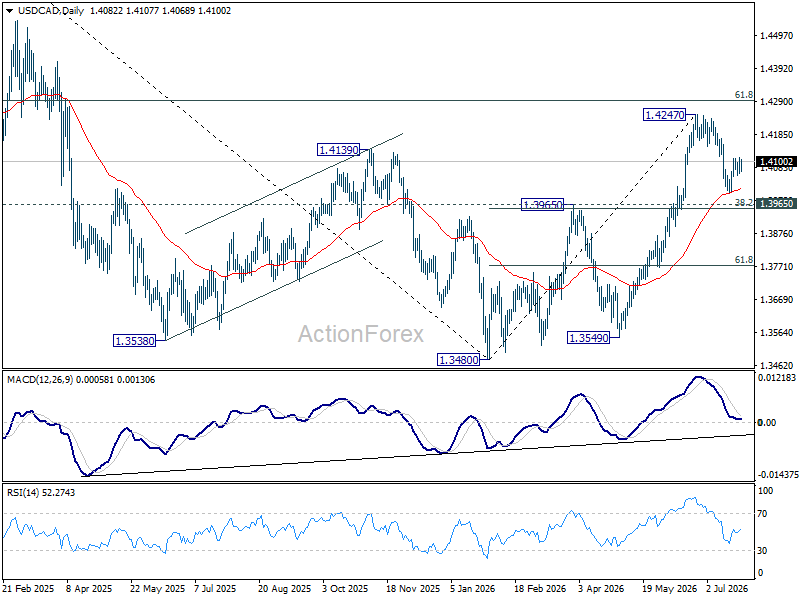
Intraday bias in USD/CAD remains neutral for the moment. . On the upside, firm break of 1.4115 will indicate that corrective pullback from 1.4247 has completed, and bring stronger rally to retest this high. In case of another fall, downside should be contained by 1.3965 cluster support (38.2% retracement of 1.3480 to 1.4247 at 1.3954 to bring rebound.
In the bigger picture, current development suggests that fall from 1.4791 has completed as a three wave correction to 1.3480. It's still early to judge if rise from there a corrective bounce, or resumption of the larger up trend from 1.2005 (2021 low). But in either case, retest of 1.4791 high should be seen next.
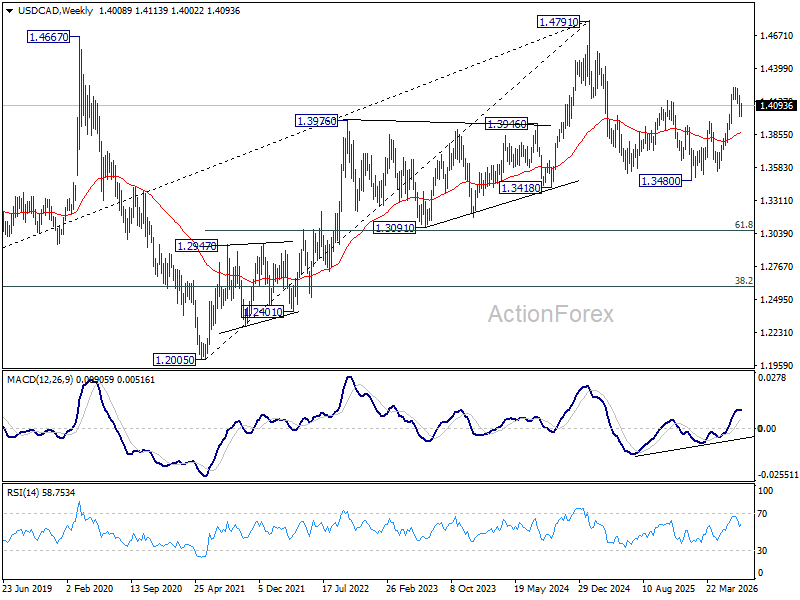
USD/CAD Weekly Outlook
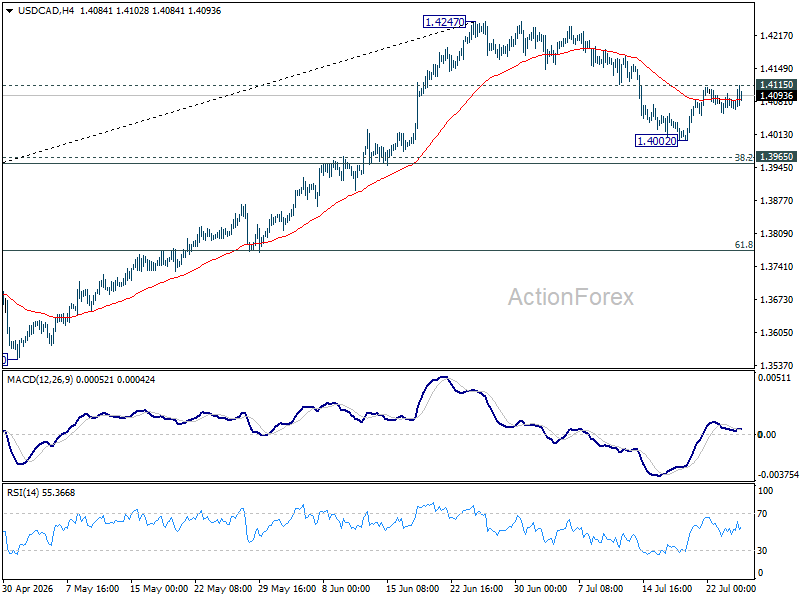
USD//CAD recovered after dipping to 1.4002 last week but failed to break through 1.4115 minor resistance. Initial bias remains neutral this week first. On the upside, firm break of 1.4115 will indicate that corrective pullback from 1.4247 has completed, and bring stronger rally to retest this high. In case of another fall, downside should be contained by 1.3965 cluster support (38.2% retracement of 1.3480 to 1.4247 at 1.3954 to bring rebound.
In the bigger picture, current development suggests that fall from 1.4791 has completed as a three wave correction to 1.3480. It's still early to judge if rise from there a corrective bounce, or resumption of the larger up trend from 1.2005 (2021 low). But in either case, retest of 1.4791 high should be seen next.
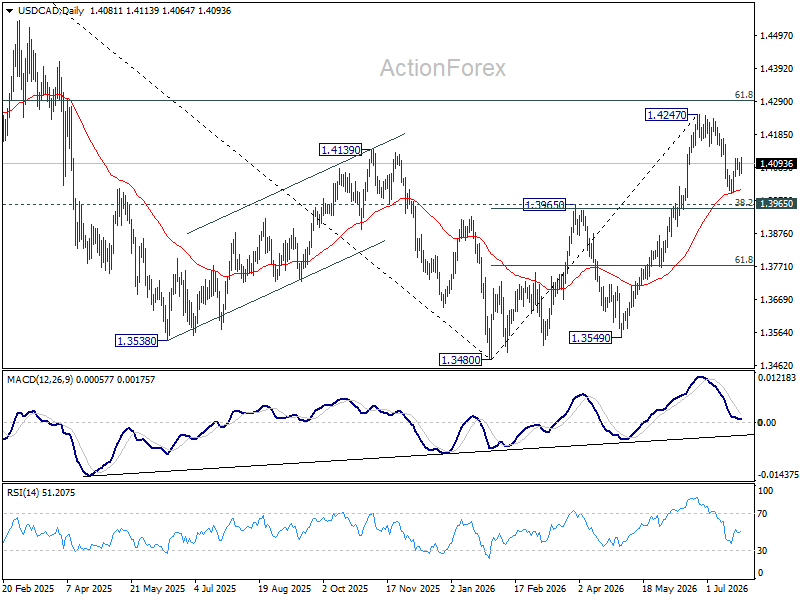
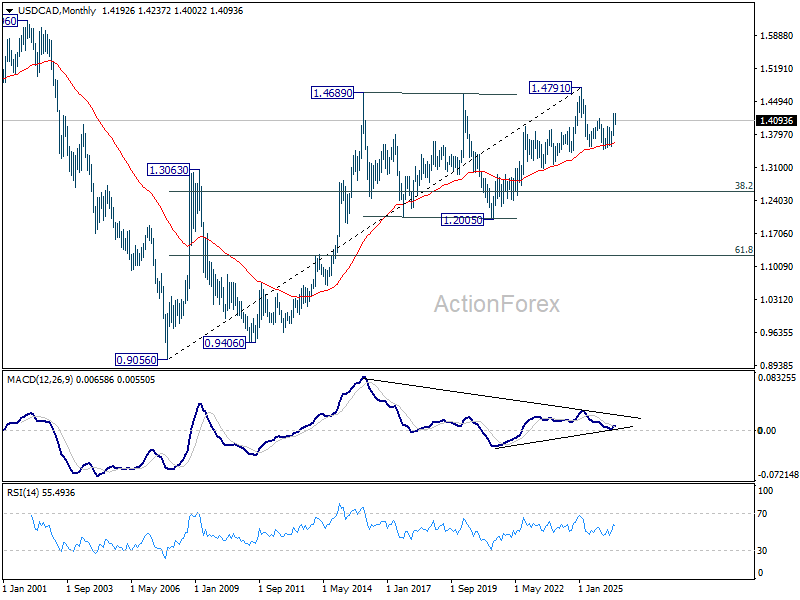
In the long term picture, rising 55 M EMA (now at 1.3631) remains intact. Thus, up trend from 0.9056 (2007 low) could still be in progress. However, considering bearish divergence condition M MACD, sustained trading below 55 M EMA will argue that the up trend has completed with five waves up to 1.4791, and turn medium term outlook bearish for correction to 38.2% retracement of 0.9056 to 1.4791 at 1.2600.