
Amidst the Great Depression in 1933, U.S. president Franklin Roosevelt’s inaugural address cited the now-famous phrase “the only thing we have to fear is fear itself” . Today’s financial markets and economic environment bear zero resemblance to that period, but the words remain fitting given media headlines filling up with “recession talk”. Let’s take a quick look at what the data reveals and compare it to the rhetoric. Financial and economic indicators have yet to breach levels that would signal an impending recession. This needs to be the first pillar to fall into place. Once it does, the historical signals have provided a one to two year advance notice of the recession. Because economic cycles don’t follow the same pattern due to differences in risks, it’s important to look at a broad set of data.
Financial Market indicators:
1. Volatility
How many times have you checked the stock indexes at 11am and then again at the close, only to find out that neither bore any resemblance to each other? One of the more notable shifts between 2017 and 2018 occurred with financial market volatility. We offer some selections below on how this volatility is captured in the data, and compares to other periods.
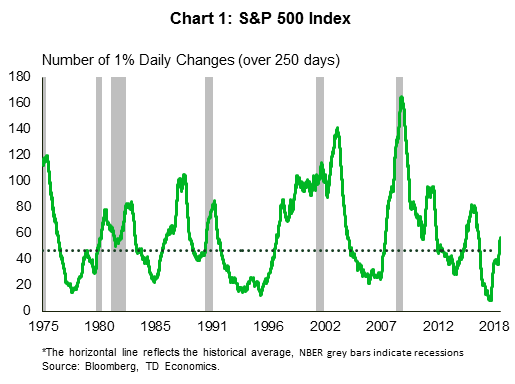
The number of 1% changes in the value of the S&P 500 index in a single day has broken just above the historical average, but remains below other non-recessionary periods (Chart 1). Sudden stock market swings can cause nausea, but it’s not the most reliable predictor of a recession (Paul Samuelson’s famous remark was that stock markets have predicted nine of the past five recessions). If we took our cue from equity price movements, we would be on our third recession call since 2009. Eventually this indicator will be right when there are parallel or supportive movements occurring within other risk-assets.
2. Risk assets
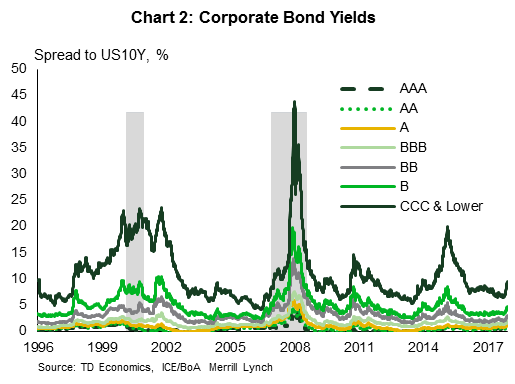
On that front, take a look at corporate bond yields (Chart 2). Yields and spreads have edged up, but maintain a healthy margin below other “stress” periods, such as the European debt crisis (2011), China growth concerns (2015) and even ahead of the 2001 recession. This latter period is of interest, because the center of risks in this economic cycle resides within high corporate leverage (as opposed to a consumer cycle marked by household leverage). We might expect this cycle to have some parallel to 2001 as investors head for cover, but that has yet to occur.
3. Yield curve
One of the most reliable forward indicators of a recession is the U.S. Treasury yield curve. There’s been much ado about the flatness of the curve, and we have written extensively on this topic. (See report)
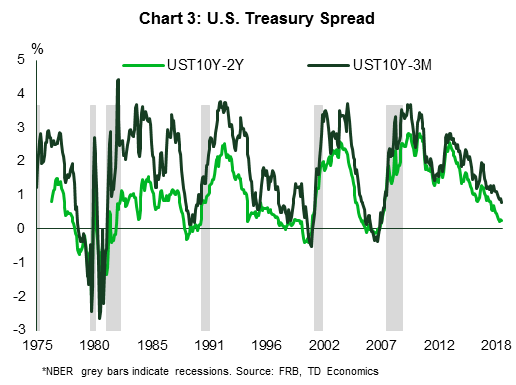
On this metric, the UST 10-2yr curve has flattened to roughly 13-15 basis points. As Chart 3 demonstrates, the spread looks uncomfortably narrow, but has yet to invert. In the event that it does, it has offered a one to two year lead-time to the start of a recession in the case of the 1990, 2001 and 2008 experiences. Importantly, the first of the two conditions has yet to even fall into place.
In December, the UST 5-2yr spread popped onto everyone’s radar when it inverted by 1-3 basis points. This is not typically the spread monitored as a recession signal, but it should definitely be watched as a possible precursor for the rest of the curve. There’s a clear risk the inversion at the front of the curve reflects the settling in of more dovish market sentiment that is second-guessing the economic outlook relative to the Fed’s policy path. Of note, this segment of the curve is a bit more prone to very long lead times (i.e. 1998, versus the eventual shallow recession in 2001). It would also likely need to move deeper into negative territory to offer a more convincing signal. At the time of writing, the spread was bouncing around from being perfectly flat to only -1 basis point.
Since it’s such a shallow inversion, the natural inclination is to first decipher whether technical factors may be at play. This is possible given the Fed’s asset unwind initiative following years of Treasury accumulation under the quantitative easing program. Certainly an area prone to distortions is the 1-5 year tenure space, where the Treasury has focused its issuance in recent years. A Reuters article recently noted that, after amassing a record level, hedge funds and other speculators had suddenly scaled back on bets that Treasury prices would decline1. The heaviest of this action occurred against 5-year maturities. Since none of the other financial indicators are flashing red, a very shallow inversion within only a segment of the curve would suggest other factors may indeed be at play.
The Federal Reserve would likely dismiss the inversion as a technical factor and certainly other international agencies have noted the greater potential for the yield curve to send false signals during this cycle due to the distortions created by large central bank balance sheets. However, we think that when it comes to the bond market, follow the money. Should the inversion broaden out across tenures, alongside dovish signals from other economic or financial indicators, then our bet is on the bond market calling it right. But, that day is not today.
Economic Market Indicators:
4. Economic risk index
Aside from financial market indicators, we’ve constructed an economic risk-index to capture turning points in performance (Chart 4). This index is a catch-all of economic indicators spanning production, the labor market and consumer patterns. The zero line captures the historical average. At a -1 standard deviation, the data corresponds with a recession. Waiting to call a recession at that point would be old news, so ideally the red-flag should be raised at the half-point mark, with a yellow-flag going up once it tips below the zero threshold. However, caution is needed due to the probability of false-positives.
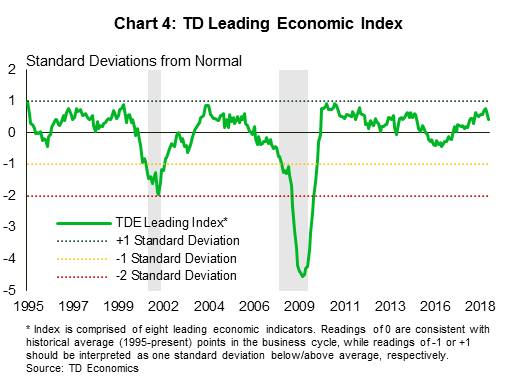
In any event, the current indicator is far off all of the markers that would send up any cautionary flags. And, if you’re wondering about the recent dip in the index, it’s due to business orders. More specifically, the culprit is deteriorating export orders. This likely reflects the combination of slowing global growth that is being further exaggerated by the U.S. trade war impact.
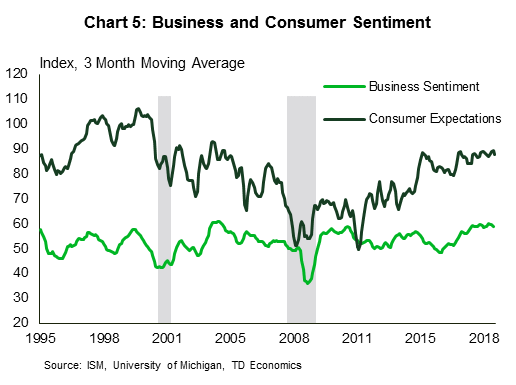
5. Confidence
The last of the data round-up needs to be with confidence measures, which critically lay the foundation for any business cycle. Here too, both business and consumer sentiment are holding at elevated levels, which is even a bit surprising given the rise of “recession” talk within financial market circles (Chart 5).
For example, take the release of U.S. employment data in early December. The news headlines highlighted the disappointment of “only” 155K jobs, which was below market expectations. With a bear-tone embedded in the market, this payrolls report was doomed for failure. Basically, a strong report would have been dismissed with a neutral market reaction, but a weaker-than-expected report serves to reinforce negative bias when risk-off sentiment dominates. We have commented before that what’s most astounding is that the U.S. continued to post job numbers in excess of 200K for most of this year, fighting against the dynamics created by a tightening labor pool and worsening demographics. For 2018, the average monthly job tally is 207K and the unemployment rate is near a 50-year low at 3.7%. A reasonable market expectation would be for job gains at around 150K as a marker of a more sustainable expansion, rather than north of 200K. And, if a further reality check is needed, the string of positive job gains that has occurred in this expansion cycle (i.e. post-2009) is the longest on record at 98 consecutive months, even though the business cycle has yet to make the claim of fame as the longest on record.
Will the business cycle fall prey to Beetlejuice syndrome?
All this to return us to where we began: the only thing we have to fear is fear itself. According to a quarterly Duke University CFO Global Business Outlook survey, almost half (48.6%) of U.S. chief financial officers believe the economy will be in a recession by the end of next year2. Interestingly, these same CFOs believe the U.S. will expand by 2.7% in 2019. This is above our own estimations of 2.5%, suggesting that incongruent or lofty expectations may be the problem here, rather than the actual data trends.
However, beliefs and sentiment create outcomes. Business investment intentions become more cautious, and we risk having a prophecy be fulfilled by behavior adjustments, particularly if households respond in a similar fashion. In economics, this is captured by the notion of the paradox of savings (or thrift). A small number of firms or individuals deciding to take a precautionary stance in investing less or saving more due to their individual financial statements does not have widespread ramifications. But, when it occurs on a large scale, it actually lowers the national output and income, resulting in less savings, which subsequently causes more precautionary behavior to set in, creating a downward spiral. Take note if there’s a chorus of people saying, “I’m not buying that house until the recession hits, then I’ll get a better deal.”
Could 2019 be our “Beetlejuice year”? Just like the movie, saying a word too many times makes it appear. Time will tell and we’ll keep a close eye on the data. But for now, we suggest hitting the “pause” button on using the recession word until there’s stronger evidence in the data. This may prove to be a hard thing to ask of financial markets, however. As we’ve detailed in our latest quarterly economic forecast, there is little question that global and U.S. economic momentum has passed the high-water mark – as it should on demographic fundamentals, capacity constraints and less monetary accommodation. This has been well telegraphed in our forecasts, but the market and media response will be a harder call.
In particular, government decisions will play a much larger role in 2019. Event risks will carry even more influence than in 2018 due to fast approaching deadlines occurring in the first quarter related to Brexit, the U.S. debt-ceiling and U.S.-China trade tensions. Any one of these would be sufficient to undermine market confidence, let alone all of them overlapping in the early part of the New Year. So, who can blame investors for being more cautious? Event risks require political solutions, are not easily forecastable and, by extension, can lead to unintended consequences.


