Yesterday, the price of crude oil dropped to a 17-month low as traders worried that higher interest rates would lead to lower growth. This came after the Federal Reserve raised interest rates and pointed to two more hikes in the coming year. The price then rose slightly during the American session after Donald Trump announced that American troops will leave Syria, a move traders fear will bring more chaos to the region. In the Asian session, the price eased a bit as traders looked ahead to US, France, and UK GDP numbers expected later today.
Yesterday, US stocks continued to decline after a series of mixed news. Important information included the Fed rate hike followed by fears of a government shutdown. Investors were also concerned about US relations with China after the country charged two Chinese officials with government espionage. The Dow, S&P, and NASDAQ ended the day down by 464, 40, and 108 points respectively making December declines the worst in more than 20 years.
After major gains yesterday, the Japanese yen declined against the USD in the Asian session. This came after Japan released the national inflation numbers. In November, inflation rose by an annualized rate of 0.8%, which was lower than October’s gain of 1.4%. On a YoY basis, the core CPI rose by 0.9%, which was lower than the expected 1.0%. These numbers are the reason why the Bank of Japan has been hesitant about raising rates.
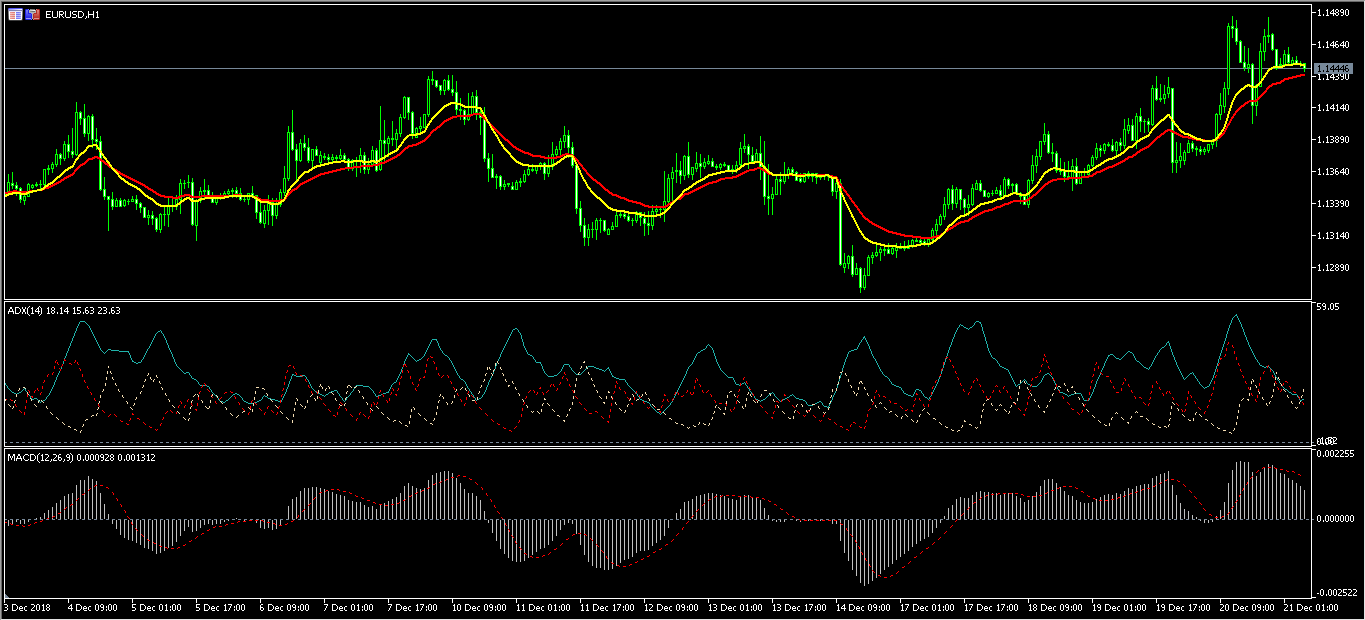
EUR/USD
The EUR/USD pair declined during the Asian session to a low of 1.1445. This decline came after the sharp rise seen yesterday. This price is along the 14-day moving average but lower than the 28-day EMA. The Average Directional Index has fallen from above 53 to the current 18 while the MACD is falling. Today, the movement of the pair will likely depend on US politics and the final reading of the third quarter GDP.
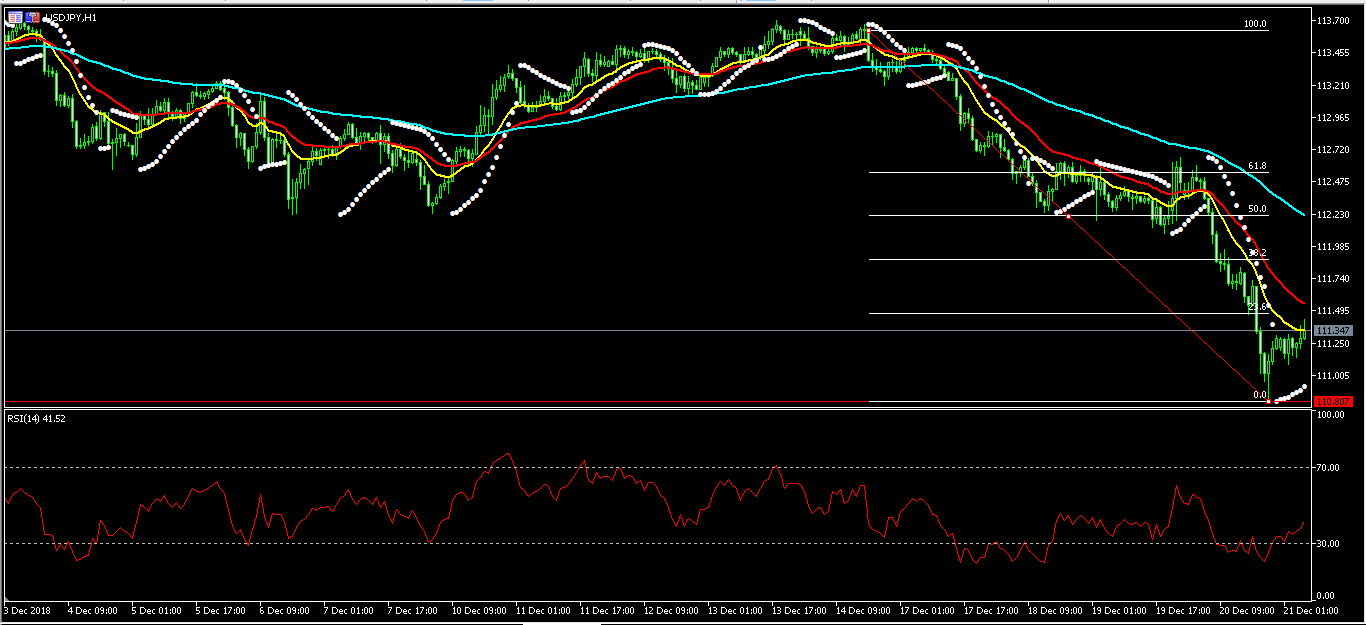
USD/JPY
The USD/JPY pair reached a low of 110.80 yesterday. Today, the pair moved up and reached to an intraday high of 111.45. The price is along the 14-day EMA and lower than the 28-day EMA. On a longer EMA, the pair is below the 100-day EMA on the hourly chart. Its RSI has emerged from the oversold level to the current 40 while the Parabolic SAR shows that the pair could continue moving up. If it does, it will likely test the 111.88 level, which is the 38.2% Fibonacci Retracement level.
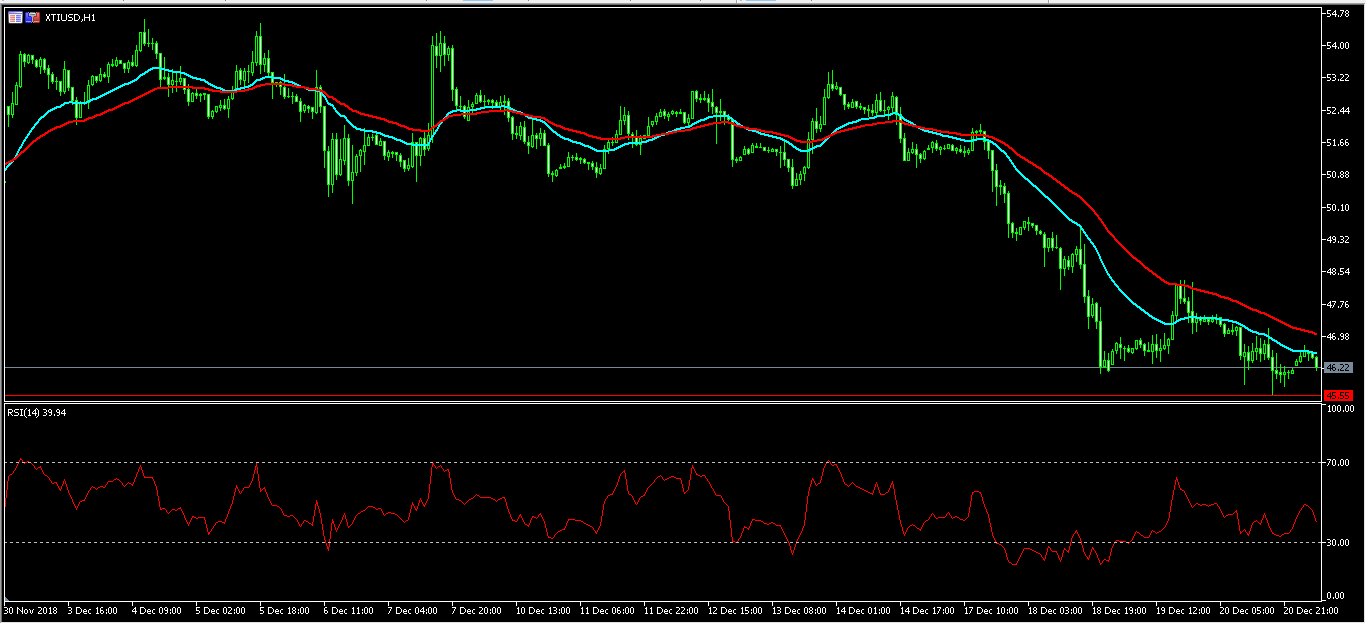
XTI/USD
The XTI/USD pair declined slightly during the Asian session and reached a low of 46.22. On the hourly chart, the pair is below the 25-day and 50-day EMA while the RSI is between the overbought and oversold levels. The pair will likely remain along these levels as the year nears the end. However, there is also a likelihood that traders could push it up because it is oversold in the daily chart.