
The basic concept for finding the strength or weakness in any particular trend is to find the sectors which usually have a high correlation with the index. This really gives you a good starting point to assess if the current trend is going to last or what factors are behind it. In other words, one needs to keep an eye on these important variables in order to have strong confidence behind their thesis.
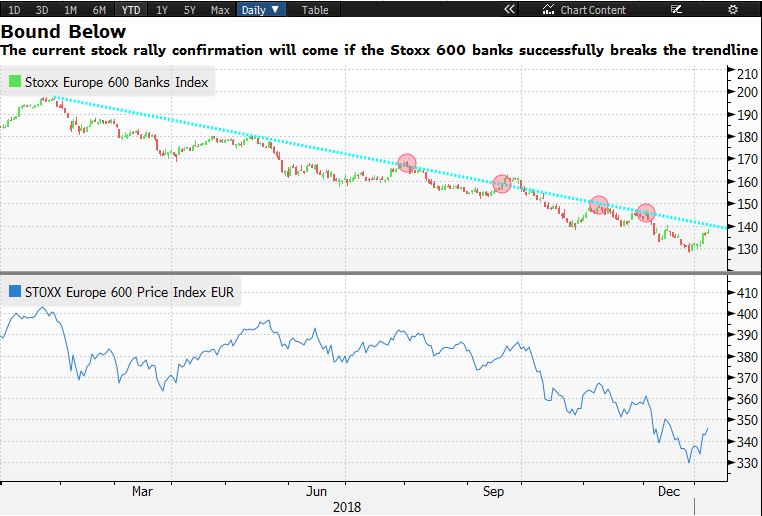
The Stoxx 600 index is up 2.43% year to date. Looking at the current stock rally across the European banking sector, one thing becomes clear, investors have decided to jump back in the riskier assets and the banking sector is one of their favourite one. There is no doubt that this was beaten down badly when the sell-off was intense (during the month of December) and the Italian debt situation only added more pessimism for this sector.
However, things have changed and the Stoxx 600 banks index is about to challenge its downward trend line once again. There have been multiple occasions that the index has challenged the downward trend line, but at each occasion (as shown in the chart below), the index has clearly failed to break above this trend line. So, if the current trend is going to continue for the Stoxx 600 index, a confirmation of this needs to come from here. A break of the downward trend line will confirm that the bottom is strongly in place. Otherwise, all bets are off.
Similarly, the current momentum in the Stoxx 600 index is also coming from another specific sector which has a strong correlation with the index. It is the energy sector. There is no secret that oil prices have seen a huge bounce from its recent lows of $42.36. I am speaking of WTI crude, it touched this level back in December 24th, 2018. Ever since, we have seen the WTI crude hasn’t looked back. By default, higher oil prices stimulate the energy stocks. This fact also has an impact on the index. Hence, the Stoxx 600 chart below shows strong bounce from its recent low. The Stoxx 600 oil and gas index bottomed pretty much at the same time when the WTI price hit the bottom. 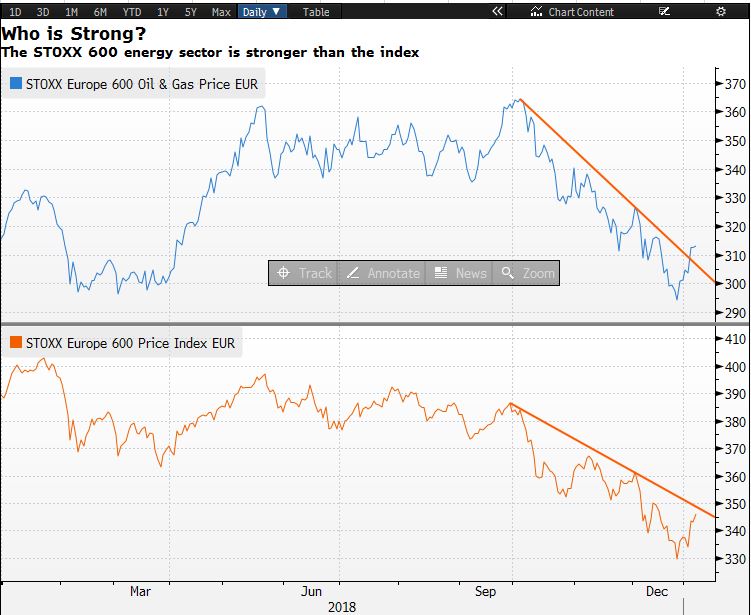
The Stoxx 600 index echo the same concept as well. One important key take away from the below chart is that the energy sector has clearly broken its downward trend and this shows that the bulls are fully in control. However, there is some lack of momentum for the Stoxx 600 index. Having saif this, the bullish momentum is still strong and as long as the energy sector continues to to move higher, the Stoxx 600 is likely to gather more momentum.


