
Highlights
- U.S.-China trade tensions remain elevated, and we continue to march towards the March 1st deadline for agreement before a U.S.-threatened broadening of tariff measures (and likely Chinese response).
- It is tempting to see these tensions as an opportunity for Canadian firms to expand their export sales and recapture market share both in the U.S. and China. Many clients have inquired along these lines.
- The reality is less positive. Sectoral scarring in the form of lost market share and reduced capacity suggests little near-term upside. Canada generally doesn’t have suitable substitutes or export capacity in key trade areas at present.
- There are some bright spots. There is early evidence that the provisional agreement with the European Union has accelerated trade. The Trans-Pacific Partnership also came into effect at the end of 2018, creating opportunities in a number of large and fast growing markets.
- Moreover, a still healthy U.S. economy augurs well for modest export growth going forward, which we expect will be accompanied by capacity-expanding investments.
- Ultimately, there is no silver bullet for accelerating trade, with increased competitiveness, seeking new markets and reducing barriers still the best recipe for longer-term success.
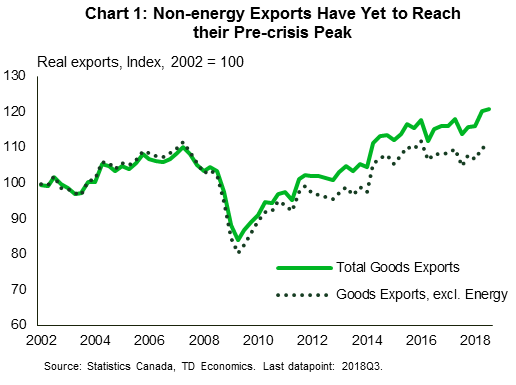
Canada continues to face headwinds both domestic and international, but has at the same time enjoyed some ‘wins’ of late when it comes to international trade agreements. The Canada U.S. Mexico Agreement (CUSMA) may not be a game changer, and US politics suggests it may take some time before it comes into effect. But its expected ratification nevertheless provides some much needed certainty to Canadian exporters. Perhaps lost in the CUSMA hubbub was the one year anniversary this past September of the Comprehensive Economic and Trade Agreement (CETA) taking provisional effect, opening up trade with one of the world’s largest economic blocs. And the Comprehensive and Progressive Agreement for Trans-Pacific Partnership (CP-TPP) recently came into effect with six of eleven signatories ratifying the deal. The benefits of new trade arrangements typically take time to bear fruit. So far, there has been an encouraging uptrend in exports to countries other than the U.S., although the importance of the U.S. means we’ve seen little overall progress when it comes to non-energy exports; trade volumes remain below pre-crisis peaks (Chart 1).
Regarding the near-term export outlook, all eyes remain on the US and China, who remain at loggerheads over their trading relationship. President Trump has repeatedly threatened to impose tariffs on the full spectrum of U.S. imports from China (currently, roughly US$200 billion of trade is subject to tariffs). As of writing, the ‘deadline’ for an agreement before additional tariffs are imposed is March 1st, 2019, which doesn’t leave a lot of runway for negotiations. There has been some reported progress in negotiations with the next round of discussions slated for January 30th. But if the talks ultimately go sideways and the US follows through with more tariff hikes, China would undoubtedly respond through increased tariff and non-tariff trade barriers.
With this sword hanging over the global economy, we have been asked what the implications of such an outcome would be for Canada. Clearly, Canadian exports in general would feel significant knock-on effects if a worsening trade war further hit global trade and financial market sentiment. Still, another question emerges: could Canadian exporters reap some benefits from falling demand in the US (China) market from more expensive Chinese (US) goods?
This analysis suggests that the answer to this question is no or limited at best. First, Canadian trade flows and production patterns have evolved along markedly different lines than those in both the US and China, suggesting little in the way of product substitutes. Canadian firms have lost significant U.S. market share in the categories that China dominates. In China, outside of energy products, the same story holds true. Second, Canadian manufacturing has undergone a prolonged period of adjustment, with capital stock and employment significantly below pre-crisis averages. This leaves firms operating at or near capacity with little room to expand output quickly (Chart 2). This lack of ‘spin-up’ capacity, is likely related to China’s ascent in U.S. imports, sapping Canadian market share (Chart 3). Finally, although service exports have been and should continue to be a higher growth area for the Canadian economy, there is little reason to expect acceleration. In contrast to goods, China’s market penetration has been more modest, limited the upside, and Canadian firms will continue to face off with those in low cost jurisdictions such as India, which has rapidly gained market share in recent years. In this vein, with few offsetting benefits in store a further escalation in the trade war between the US and Canada only represents downside to Canada’s economy.

On a happier note, we still see a good possibility that further tariff hikes will be avoided, and the latest TD Economics forecast still seeing a solid path for exports on the back of continued US expansion. The takeaway from this report is not to emphasize the downside risks, but rather the lack of upsides.
Canada not always a substitute
At least so far, despite the imposition of US tariffs on Chinese goods, the opportunities for Canadian export substitution within the US market have proven limited. This is because the tariffs already implemented have occurred alongside a devaluation of the Chinese currency, thus preserving Chinese price competitiveness. Thus, Canada’s potential to fill any export gap that is created going forward will depend in large part by the future direction of the renminbi.1
In any event, a look into the rear view mirror both underscores the potential opportunities that could be created due to China’s large and rising presence over time in the U.S. marketplace but also underscores the challenges that Canadian exporters might face in meeting that demand. The rise of China as a global manufacturing power has been a long time in the making, but the process accelerated notably following China’s accession to the World Trade Organization (WTO) late in 2001. This impact is best illustrated by the changes in China’s shares of U.S. product categories. Looking at the top 11 categories, representing 80% of U.S. imports by value, China has rapidly grown its share of the U.S. market since 2002, growing share by more than 20 percentage points in several categories (Chart 3).

By contrast, although a growing pie means that Canadian export sales in many of these categories did rise over this time, Canadian firms failed to capture a larger share of the market across all 11 categories.2 Indeed, while Chart 3 highlights the top categories for imports from China, Canada’s share of overall U.S. goods imports (including energy) is down six percentage points over the same period. Recent dynamics do not suggest any immediate change in shares/trade patterns. To be sure, there is more to the story. As noted, Canada has seen significant growth in energy exports to the U.S., and although shipments of motor vehicles and parts have been effectively flat over the past five years, they still represent a sizeable share of Canada-U.S. trade. In some other export areas, such as raw and processed food, as well as base metals and other industrial inputs, China remains a minor player in the U.S. market, while Canada has enjoyed generally rising exports.
Less capacity means less ability to meet demand quickly
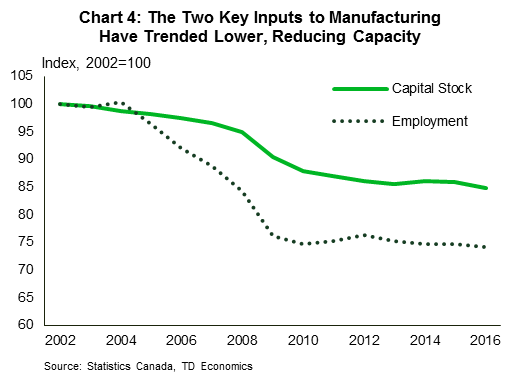
The soft performance of manufacturing sales has had a logical result: a decline in the capital stock of the industry. After all, if you’re selling less of something year after year, why go through the expense of maintaining excess capacity beyond that needed to respond to typical demand fluctuations. The outcome of this logic can be seen in the data: total capital stock in manufacturing has fallen by about 15% since 2002 (Chart 4).3 Unsurprisingly, employment in the sector has followed suit, more than 25% below the 2002 level as of 2016.
Again, differences between U.S. trade definitions and the classification of manufacturing sectors makes an apples-to-apples comparison challenging, but the dynamics again match those of trade (Table 1). The real levels of capital stock of key China-exposed product manufacturing categories are all markedly lower since 2002.4
This suggests that the ‘denominator effect’ helps explain why manufacturing capacity utilization remains roughly in line with its pre-crisis levels despite a sales trend that has been effectively flat. Even with flat sales, shrinking capacity (the denominator in the equation capacity utilization equals sales divided by sales capacity) means you are using more and more of it to satisfy demand, pushing measured utilization rates higher.
To be clear, this trend does have a silver lining in that at some point capacity will become stretched, necessitating further investment. This is one of the key reasons why TD Economics remains constructive on the outlook for Canadian business investment in coming years. But investment doesn’t turn on a dime. Getting from the ‘go ahead’ decision to an operational production line or sales office can often be a matter of quarters, if not years. This means that in practice, unless firms see trade conflicts as lasting for many years, they are unlikely to meaningfully adjust production patterns to react.
Services unlikely to be the saviour
Is a focus on goods trade the right approach to take? The falling inputs in the manufacturing sector shown in Chart 3 are likely a reflection of a changing Canadian economy. Service industries now make up more than 70% of Canadian output, and service export growth has outpaced goods over the past decade.5 As with goods, caution is again warranted, with service exporters unlikely to see significant growth opportunities.
To begin with, China is not as significant a player in the U.S. service import market. Although Chinese firms have increased their share of the pie by about a percentage point over the last 15 years, they still represent less than 4% of U.S. service imports. This may be part of the reason the U.S. administration has so far focused largely on goods. Beyond the small size of addressable Chinese market share, Canada faces challenges from elsewhere. The decline of Canadian market share (about 2.1 percentage points since 2002 even as the dollar value of exports more than doubled) is largely a story of India’s ascension.
However, even here a note of caution is warranted. Looking at the U.S. market, Canadian services have lost market share since 2002, falling from 8.2% of U.S. service imports to 6.1% in 2017, even as the dollar value of exports more than doubled. Indian service exports to the U.S. have gone from roughly one-tenth the size of Canada’s to nearly 90% in value, driving a 4.4 percentage point gain in market share.
The takeaway isn’t all negative; after all, despite these developments Canadian service exports have still managed to outpace goods. Data on service sector capacity utilization is not readily available, but employment patterns and other available data suggest that firms have continued to scale up capacity, pointing to further growth going forward. However, absent fundamental shifts in the sector, such as new/unique products, increased cost competitiveness, or another change, business as usual appears most likely, even in the event of disruptions to Chinese service provisions.6
Not just the U.S.; are there China opportunities?
Trade conflicts are a two way street; the (lack of) opportunities for Canadian firms to take advantage of potential disruptions in China-U.S. trade flows have already been discussed, but the other direction is also a possibility. The rapid growth of the Chinese economy should, all else equal, make it an attractive market for Canadian exporters.7 Indeed, Canadian exports to China have generally outpaced exports to the United States – averaging 6% growth over the past five years, vs. roughly 2% growth in exports to the U.S. (albeit from a much smaller base). This trend should continue given the growth differentials between the two countries, even in light of Chinese deceleration, and relative currency movements have also been favourable.
Could it be accelerated even further in the event of elevated trade tensions? The answer is likely not. Similar to the China-U.S. relationship, U.S. exports to China are by and large in products and categories where Canada would need to undertake significant investment to seize market share. Looking at the products that make up the top 80% of trade, we see many of the same categories discussed in Chart 2, such as electrical machinery, plastic products, optical/medical equipment, etc. Even areas of apparent promise, such as aircraft (the largest U.S. export category to China), or motor vehicles, fade on further inspection. The U.S. aircraft industry produces larger wide-body, long-range products, whereas Canada tends to produce narrow-body, regional craft, and small luxury craft. Similarly, auto exports to China are significant (approx. $1.4bn in 2017), but pale in comparison to the U.S. ($12bn). Much of the (U.S.) exports of autos to China tend to be of large, luxury, American-style SUVs. Again, as well regarded on quality and other metrics as Canada’s auto industry is, we simply don’t make these types of vehicles at present.8 Canadian exports of energy products to China have picked up of late, but remain below 2012/2013 levels, even accounting for price and exchange rate impacts.
Where opportunities exist is likely to be in the places where Canada has enjoyed rising exports: agricultural products, notably canola/rapeseed, wood and wood products, and similar categories. Canada has a natural advantage in many of these areas, and in some cases, such as wood products, the Chinese market represents an attractive complement to longstanding U.S. destinations. If we look further ahead, energy is another obvious example. The recent uptick is encouraging, but bottlenecks remain. Energy export volumes to China (and Asia more generally) are currently constrained by a lack of export capacity; if resolved, geographic pricing differentials make Canadian energy an attractive proposition for Chinese importers.
In the near term however, we ultimately wind up in much the same place vis-à-vis China as we did with the United States. The possibility of expanding market share is contingent on long-term reinvestment in key industries, with likely to be lengthy lead times before production gets underway. Again, energy sector aside, it is challenging to envision many who would be willing to take this risk given the capricious nature of international trade negotiations under the current U.S. administration.
Soy unlikely to be a big story for Canadian agriculture
Agriculture receives significant attention due to its political sensitivity, and so deserves additional discussion. China has been among the largest purchasers of U.S. soybeans, which are used as feedstock for pork and poultry production. However, with 25% tariffs now imposed on Chinese imports of soy from the U.S., these volumes have plummeted, leaving U.S. producers with significant unsold inventory.
Canada has a large, robust, and highly productive agricultural sector, so it seems logical that this could be area where Canadian farmers could naturally step in to ‘fill the gap’, particularly as Canada, unlike other major producers, shares a growing season with the U.S., meaning that our supplies would come on market roughly when U.S. supplies would have, fitting the seasonality of production/demand. In the short run however, this would require a shift in planting strategies: of the roughly 28 million hectares of Canadian farmland dedicated to grains and oilseeds for the 2018/19 growing season, only about 10%, or 2.6 million hectares are dedicated to soy (as compared with nearly 36 million hectares of soybean cultivation in the U.S.).
Even then, Canada would face other competitors such as Brazil (albeit with a different growing season), that are already world leaders in soy production and have significant trading relationships with China. On top of this, Chinese authorities have taken steps to reduce their reliance on soybeans, while also making some goodwill efforts regarding the U.S., including a token purchase for their strategic reserve.9
Suffice it to say we shouldn’t expect too much from Canadian soybean producers. This is not a story of lost opportunity however. Other crops remain attractive, and there are already growth areas for a number of Canadian products, such as the south Asian market for lentils and pulses, as well as the Chinese market for Canola/rapeseed.10 The other part of the soy story is simply that healthy markets for current production patterns also make soy a less attractive proposition.
Growth areas put at risk by geopolitics
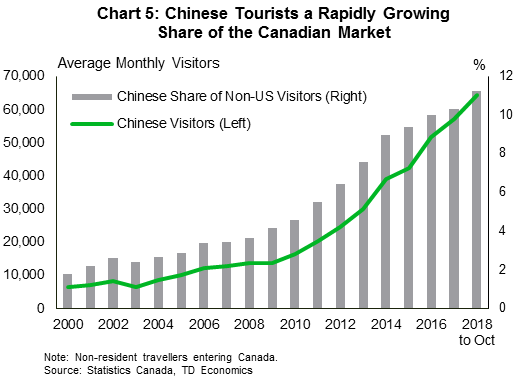
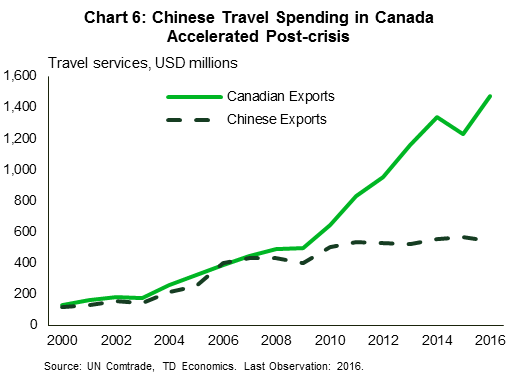
Just as Canadian goods exports to China have outperformed other regions, so too have Canadian service exports. This can largely be put down to travel services, i.e. tourism. Chinese visitors to Canada have more than quintupled since 2002 (Chart 5). The increase in spending has been even more dramatic, reaching more than US$1.5 billion in 2016, the latest year available (Chart 6). While the size of these figures pale in comparison to Canada’s overall trade, they are still a source of (diversified) growth.
Recent developments have cast a cloud over this sector. In particular, a recent diplomatic spat has ignited tensions, with both sides issuing travel warnings to citizens, among other actions. It is beyond the scope of this report to get into the politics of the situation, but suffice it to say that further escalation of tensions in this regard would clearly be negative for this sector, along with others that have significant Chinese demand, such as education.
Other opportunities are presenting themselves
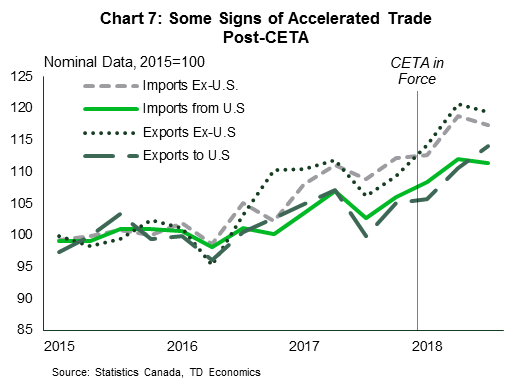
It is not all bad news for Canada. Trade diversification remains a national priority, and both past and current government efforts in this regard are beginning to bear fruit. Late 2017 saw the Comprehensive Economic and Trade Agreement (CETA) enter provisionally into effect, and there is already some early evidence that Canadians are seeing the benefit of better market access abroad and better purchasing power at home (Chart 7). This can be seen most clearly in the export data, where shipments to the EU accelerating markedly of late (Chart 8). The chart also reinforces that even ahead of trade tensions Canada enjoyed strong export demand from China, albeit in different product categories than observed for the United States.

More recently, December 30 marked the introduction into force of the Trans-Pacific Partnership (CP-TPP), which reduces trade barriers with a number of fast-growing economies in the Pacific Rim and South America.11 As with most trade arrangements, we should not expect massive change overnight, but the conditions have been created for a further expansion and broadening of Canadian trade. Most importantly, the multilateral nature of the agreements means that no single member dominates, which implies a predictable backdrop for trade, important for long term business planning.
Bottom Line
The idea of Canadian firms rushing to fill the gaps created by U.S.-China trade tensions is an appealing one, but unfortunately such a scenario appears unlikely. The structure of the Canadian economy and export sector has changed, likely a result of China’s ascension in global supply chains. This means that we do not have the capacity to respond quickly to trade opportunities. What’s more, any such response is likely to be muted as it would represent a significant ‘bet’ on a long-term change in policy from a capricious U.S. administration.
Put simply, there are no winners in trade wars, and as recent events have shown, even bystanders can be pulled into the melee. It is not all bad news however, as Canadian exports continue to show signs of diversification, likely to be aided by the CP-TPP. Conditions in the U.S. remain favourable, and we have also seen a solid performance in service exports of late. Ultimately, with no ‘easy fix’, Canadian firms and policymakers should remain focused on increasing their competiveness, finding new markets, and reducing trade barriers.
End Notes
- Economic theory would suggest that relative prices (i.e. exchange rates) should move to offset tariffs, however, this assumes that exchange rates are market determined, an assumption that does not apply to China at present.
- Energy exports, not shown here as China does compete in this category, are an obvious exception.
- Unfortunately, this data is only available with a significant time delay. Business investment recovered from 2017 following a two year slump, but is unlikely to have meaningfully moved the capital stock.
- Notably bucking this trend are primary metal, non-metal mineral products and petroleum/coal product manufacturers. These are all areas that are largely spared from competition with China in the U.S. market.
- In the decade to 2017, real goods exports have grown at an average pace of 2.0%, while service exports grew 2.6% on average. However, service exports still make up less than 20% of total exports.
- There is another sort of export that bears mentioning: foreign affiliate sales are those that occur in another country, but by a Canadian-controlled firm. This category recently grew larger in size than total goods exports, but represents a change in in a few important ways that are beyond the scope of this report. At a very high level, the income still accrues to Canadians eventually, but timing and form differ, notably as production wages and investment occurs in the foreign jurisdiction.
- It is of course not this simple given the closed nature of the Chinese economy, requirements around joint ventures/technology sharing, etc.
- An exception is Toyota Motor Manufacturing Canada, which manufactures the Lexus RX-series luxury SUV. However, this vehicle is also manufactured at a Japanese facility, likely to pick up any additional demand in the event of further trade tensions.
- There have also been actions taken to reduce the reliance on soy products in Chinese agricultural supply chains, notably an adjustment to protein regulations for animal feed.
- For a more detailed analysis of current planting year conditions and projections, please see Agriculture and Agri-Food Canada’s Outlook for Principal Field Crops.
- Specifically Australia, Brunei, Chile, Japan, Malaysia, Mexico, New Zealand, Peru, Singapore, and Vietnam.


