
U.S. Highlights
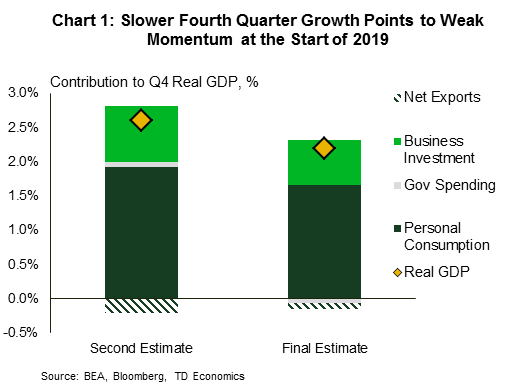
- The U.S. economy expanded at a slower pace than previously reported in the fourth quarter (2.2% vs. 2.6%). This left annual average growth at just below the 3% mark, though Q4/Q4 they were just able to hit that psychological marker.
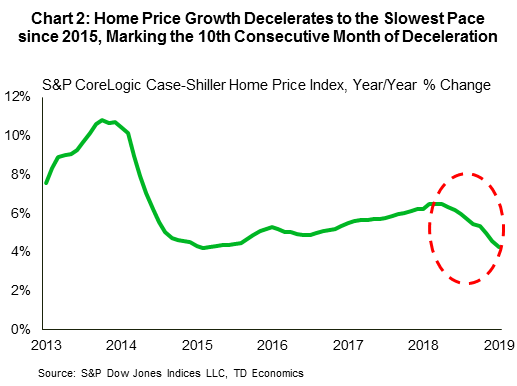
- Housing starts declined in February, though the sale of new homes picked up. A recent deceleration in home price growth should support an expected rebound in housing activity in the months ahead.
- The trade deficit narrowed in January, aided by a decrease in the goods deficit with China – down $5.5B. On this front, trade talks between the two countries made progress as China showed willingness to negotiate on tech-related concerns.
Canadian Highlights
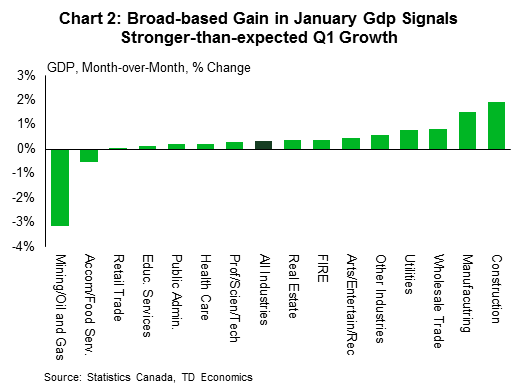
- The highly-anticipated January GDP report blew away expectations, with the economy expanding at a healthy 0.3% rate to begin the year. What’s more, the breadth of the expansion was impressive, with output higher in 18 of 20 industries.
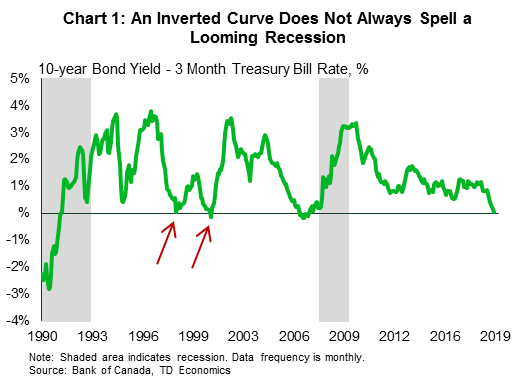
- The strong GDP report brightened the mood of financial markets. It sent bond yields and the Canadian dollar higher, narrowing the inversion in the yield curve, and causing investors to pare back their bets on a rate cut this year.
- Payroll employment expanded by a healthy 71k in January, capping an overall healthy week for Canadian data.
U.S. – When the Downside Risks Loom Large
Hang on to your hats folks. With Fed speeches, Brexit votes, and a slew of economic data, this week was exhilarating.
First, on the data front, the American economy expanded by 2.2% (annualized) in 2018Q4, down from the 2.6% rate initially reported (Chart 1). The revision brought annual average growth to 2.9%, though Q4/Q4 growth was 3%. Consumer spending, government expenditure and business investment were all revised lower, while net exports showed a smaller deficit. Corporate profits also stalled in Q4. These data point to a slowing trend and a weaker handoff to 2019. Reinforcing this narrative, personal income and spending kicked off 2019 with tepid gains. PCE inflation was also muted at 1.4% (y/y) overall and 1.8% for core.
Housing data also came in on the disappointing side. Housing starts declined 8.7% in February, giving back most of the gains in January. The turn lower was concentrated in the single family segment. Meanwhile, the pace of new home sales perked up to the best rate in almost a year (4.9%). Additionally, in January, home price growth decelerated to the slowest rate in almost 4 years – 4.3% (y/y) down from 4.6% a month earlier. It also marked 10 consecutive months of slowing growth (Chart 2). Higher mortgage rates earlier in 2018 and the past run-up in home prices dented affordability. However, recent declines in rates, smaller price gains, and rising wages should result in improved activity going forward as housing demand rebounds (see report).
On the trade front, the trade deficit narrowed sharply in January, from $59.9bn to $51.1bn, implying less of a drag on GDP growth from net trade in 19Q1. The improvement largely reflected shifting trade with China. Fortunately, there appears to be some progress in negotiations. China is offering concessions on technology-related issues, which had been a major sticking point for U.S. negotiators. Trade talks continue in Washington next week.
Across the pond, the Brexit saga continued to unfold, leaving a lingering air of uncertainty. The UK’s Parliament failed to come to a consensus on alternatives to the withdrawal agreement on Wednesday. Out of eight options proposed, not one was able to garner the needed majority. Parliament voted for a third time against the deal today, the day Britain was originally set to leave. Prime Minister May, who offered her resignation in exchange for support, continues to face an uphill battle to consolidate opinion on a deal. Debate on a deal is expected to continue next week.
Lastly, a parade of Fed speakers made the rounds this week. Among them, Chicago Fed President Evans echoed sentiments expressed in last week’s Fed statement – a rate hike for 2019 is likely not in the cards, while his Philadelphia counterpart, Patrick Harker, suggested one hike could be appropriate. All told, policy normalization at the Fed is quite likely nearly complete, as rising global risks leave the U.S. exposed to foreign shocks.
Canada – Strong GDP Print Brightens the Mood in Markets
After a steady diet of pessimism had permeated financial markets in recent weeks, the mood was brightened to end this week. The improved sentiment came courtesy of a robust January GDP report, showing that the economy started 2019 on a much stronger footing than analysts had expected. The upside surprise on GDP sent the yield on the 10-year benchmark bond up over 1.6%. The strong print also caused investors to significantly pare back their bets on a rate cut this year.
As of writing, the yield curve remains inverted – the three month yield sits at about 1.67% – but the gap narrowed by 5 basis points relative to where it was on Monday. At this juncture, we remind readers that, as a recession predictor, the yield curve has been fairly reliable for the U.S. economy. However, it is by no means perfect (see report). In Canada its track record is perhaps even less impressive, having sent a false signal a few times (Chart 1). Indeed, when reading the recession tea leaves, investors are better served by examining a range of indicators.
On that front, January employment data from the SEPH released this week sent a decidedly non-recessionary (albeit backward looking) signal. Indeed, payroll employment expanded by a solid 71k in January, the strongest gain since early 2017 and confirming the strength in the more timely LFS data that is used in calculating the unemployment rate. While other aspects of the report were softer, the solid jobs print had marginally positive implications for our Q1 tracking.
Elsewhere on the data front, January international trade data was notably less positive for Q1 growth prospects. The 0.9% gain in export volumes only partially offset December’s drop, and was swamped by the 1.5% rise in imports.
While the SEPH and international trade data whet the appetites of analysts, January’s GDP report was undoubtedly the main course. As noted above, the report blew away expectations, with the economy expanding at a healthy 0.3% pace in January. The breadth of the expansion was impressive, with a full 18 of 20 sectors seeing higher output in the month (Chart 2). The construction sector led the way, where output expanded by 1.9%, breaking a string of seven straight monthly declines. Notable gains were also recorded in manufacturing, wholesale trade, and utilities output. Amid nearly wall-to-wall strength, the only real fly in the ointment was the mining, quarrying, oil and gas sector, where production curtailments in Alberta helped send output lower.
The upside surprise on GDP pushed our Q1 tracking all the way up to 1.1% (SAAR), roughly in line with the Bank of Canada’s last read in January. Still, this below-trend pace of growth is unlikely to stir any fundamental inflation pressures or require action on rates from the Bank of Canada. In our view (see report), the current overnight rate of 1.75% is neither too hot, nor too cold, which should leave monetary policy on the sidelines for some time yet.
U.S.: Upcoming Key Economic Releases
U.S. ISM Manufacturing Index – March
Release Date: April 1, 2019
Previous: 54.2
TD Forecast: 54.5
Consensus: 54.5
We look for a minor gain in the ISM index as the regional Fed surveys suggest manufacturing activity is holding up or may have even recovered in March. Indeed, the average of the ISM-adjusted regional surveys registered its first increase in four months to 54.2 in March, as only one out of the five surveys registered a decline. Based on the regional data, we anticipate improvements in the production and employment components of the survey, which are likely to be paired back by a decline in new orders. That said, across-the-board weak global manufacturing PMIs increase the risk for a downside surprise in March.

U.S. Retail Sales – February
Release Date: April 1, 2019
Previous: 0.2%, ex auto: 0.9%
TD Forecast: 0.2%, ex auto: 0.3%
Consensus: 0.3%, ex auto: 0.4%
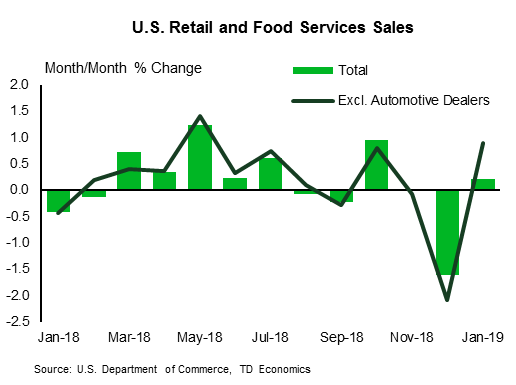
We expect retail sales to have advanced at a 0.2% m/m pace in February, on the back of a solid increase in gasoline sales (its first in four months) and a more subdued gain in sales in the control group. We expect the former to have advanced a firm 0.4% m/m as gasoline prices continue to recover, while the latter likely mean-reverted (+0.3% m/m) following an eye-popping 1.1% jump in January. On the contrary, we expect auto sales to have remained mired, posting a second consecutive monthly drop in February.
U.S. Employment – March
Release Date: April 5, 2019
Previous: 20k, unemployment rate: 3.8%
TD Forecast: 165k, unemployment rate: 3.8%
Consensus: 180k, unemployment rate: 3.8%
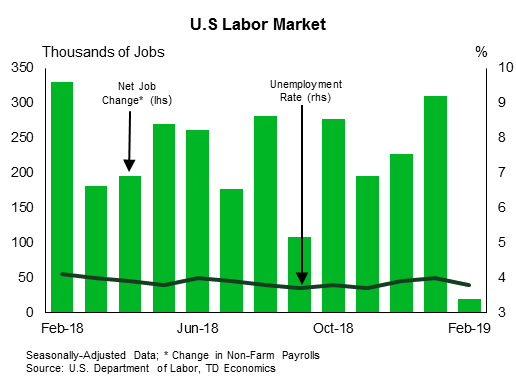
Following two zig-zagging reports for January and February, we look for payrolls to return to a more sustainable 165k print in March. In particular, we expect a recovery in employment in the construction sector following a sharp decline in February that probably reflected adverse weather effects. In addition, both manufacturing and services jobs should also register more trend-like gains as suggested by the regional Fed surveys. We look for the improvement in services employment to be led by job gains in the education and leisure sectors. All in, the household survey should show the unemployment rate remained steady at 3.8% in March, while we expect wages to rise by a “soft” 0.3% m/m pace as we anticipate some payback from the February rise. This should bring down the annual print by a tenth to 3.3% in March.
Canada: Upcoming Key Economic Releases
Canadian Employment – March
Release Date: April 5, 2019
Previous: 56k; unemployment rate: 5.8%
TD Forecast: 0k; unemployment rate: 5.9%;
Consensus: N/A
TD looks for employment levels to remain unchanged in March as firms hit pause after hiring over 100k workers over the first two months of 2019. Given the inherent volatility of the labour force survey, it is difficult to rule out further gains but we would note that the current 6m trend for job growth (48k, 29k full time) is entirely at odds with broader conditions in the Canadian economy. Unchanged employment should see the unemployment rate tick higher to 5.9% barring any unforeseen change to labour force participation while wage growth should hold at 2.2% y/y. Hours worked will also come under scrutiny after three consecutive declines that have seen total labour input fall into negative territory on a year-ago basis for the first time in two years. Further softness here would underscore the recent slowdown in the Canadian economy and undercut the message from strong employment gains.


