
Highlights
- Slowing global growth, rising trade tensions and soft inflation have led to expectations that the Federal Reserve’s next move will be a rate cut.
- Rate cuts have typically coincided with recessions, but not always. The Fed cut rates by 75 basis points in 1995 and again in 1998, taking out “insurance” against the possibility of an economic deterioration that ultimately proved successful in avoiding it.
- These two instances offer some lessons as to what factors may push the central bank toward “insurance cuts.” In the first case (1995), the catalyst was domestic economic deterioration following a relatively swift tightening in policy. In the second (1998), global factors and an extreme bout of risk aversion in financial markets led the Fed to cut rates.
- Of the two episodes, the latter experience shows more parallels to today. U.S. economic activity has held up relatively well, but global conditions are fragile and financial markets remain on edge in response to trade wars. Should a policy shock tip the scale, the Fed is one of the few central banks that can respond by easing policy, and the most likely to do so.
When the Federal Open Market Committee (FOMC) raised the federal funds rate in December 2018, its preferred inflation metric sat at the 2.0% target.1 It has since softened to 1.6%. This slowdown, along with comments by a handful of Fed members, has raised market expectations that the Fed’s next move will be a rate cut.
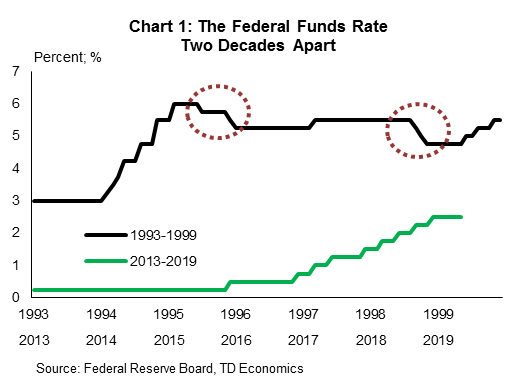
The notion of “insurance cuts” harkens back to the mid-1990s, which was the last time the Federal Reserve adjusted policy in what – with hindsight – proved to be outside of a recession. Faced with softer-than-expected economic growth, the FOMC cut the federal funds rate by a cumulative 75 basis points from July 1995 to January 1996. It did so again in late 1998 due to deterioration in the global economy and a rapid tightening of financial conditions (Chart 1).
Our baseline expectation is for the Federal Reserve to remain on hold over the remainder of this year, but the notion of insurance cuts cannot be readily dismissed should policy or external shocks prompt further economic deterioration, or should financial conditions tighten significantly. Today’s international backdrop sits on a thinner growth cushion relative to past years, leaving it more susceptible to forecast misses or policy shocks, even if modest in nature. Likewise, the U.S. domestic economy has come down from its 2018 cloud, as leading indicators on business sentiment show some convergence to global peers. Simply put, unintended outcomes today carry more risk than those of yesterday.
Insurance cut versus trial-and-error process
There was a clear distinction between the two non-recessionary periods where the Fed cut 75 basis twice over in the 1990s. The 1994-1995 period can be characterized as part of the trial-and-error process of the Federal Reserve searching for the appropriate neutral rate. We’ve written extensively on this topic, noting that there’s theory but not precise science backing the setting of a neutral rate.
Between January 1994 and February 1995, the federal funds rate had risen a steep 300 basis points to 6.0%. This was an aggressive response that included rate hikes of 50 basis points (two meetings) and 75 basis points (two meetings). Based on the data the Fed had on hand at that time, the American economy was expanding at an average rate of roughly 4.0% through 1994. Theory supported an economy pushing swiftly into excess demand territory, where inflationary pressures would threaten the stability of the expansion if left unchecked.
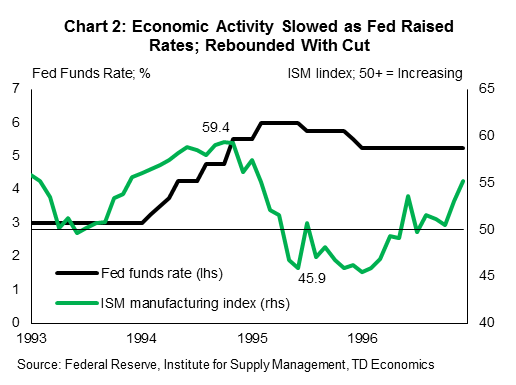
Following the rapid adjustment, the Fed went into wait-and-see mode to gauge economic activity and inflation. By July of 1995, it become clear that a more rapid deceleration was materializing relative to the Fed’s forecasts. The FOMC minutes from that meeting noted sluggish consumer spending, decelerating business investment, and a “substantial” decline in nonfarm payroll employment in May (-101k) “after a small decline in April.” Adding to the body of evidence was a rising unemployment rate and a swiftly plummeting leading indicator: The ISM manufacturing index moved deeply into contraction territory, falling nearly 13 percentage points in less than eight months (Chart 2).
There was clear supportive evidence that the Fed’s rate-setting exercise may have overreached and this motivated an adjustment to rates, with a 25-basis point cut in July. Thereafter, the Fed returned to wait-and-see mode, monitoring the data. Although the economy stabilized, a subsequent deceleration in inflation opened the debate on whether the economy had more room to run. Six months after the first cut, the Fed followed through with a second noting:
Since the last easing of monetary policy in July, inflation has been somewhat more favorable than anticipated, and this result along with an associated moderation in inflation expectations warrants a modest easing in monetary conditions.
The FOMC cut a final 25 basis points in January 1996. At the time, a government shutdown had resulted in the delay of several key economic data releases (sound familiar?). Still, what data was available pointed to somewhat slower growth and weaker inflation, enough for one last cut.
Lower rates, better job market today
There are a few obvious differences between the mid-1990s experience and today. First, today’s Fed has lifted rates cautiously, at roughly one-third the pace seen then. This leaves the real (inflation adjusted) rate at a mere 1.0%, compared to 3.9% at the height of the 1995 episode.2 Even after cutting rates during that period, the real fed funds rate was 225 basis points above where it is today.
Second, the pullback in labor demand factored materially into the Fed’s decision to edge down the policy rate. In contrast, the labor market of today seems to repeatedly defy expectations on the upside. Looking past typical month-to-month data volatility, the year-to-date trend is holding at 190k jobs, slightly below the pace set this time last year with an economy that produced 3% GDP growth for the year. Recent upward movements in the unemployment rate have had more to do with an influx of workers being enticed back into the market, than weakness in labor demand. Still, the unemployment rate of 3.6% in April sits 70 basis points below the FOMC’s median long-run estimate.
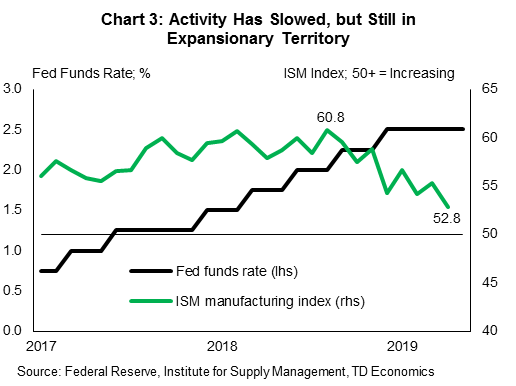
While the economic backdrop differs today from 1995, the period offers a glimpse of the Fed’s willingness to be flexible when data deviates from their prior assumptions in the trial-and-error exercise of setting monetary policy. Indeed, there have been some unfavorable data trends unfolding today that could prompt a cut should further deterioration become apparent. Take the manufacturing ISM index. This leading indicator has come off the boil, falling eight points in eight months. However, it remains in expansion territory at 52.2. A sustained breach below the 50 threshold alongside softening labor demand or inflation could trigger a red flag at the Fed, as it did before (Chart 3).
Clear parallels to 1998 in global backdrop
However, we are more intrigued by the late 1990s experience, where there are several interesting parallels to today’s environment. In 1998, the domestic economy was relatively stable, with only some pockets of softness, as we see today. But, the global environment had become precarious and financial conditions had weakened considerably in the lead up to rate cuts.
As it was then, the greater concern today is a kick-up of market anxiety due to the intersection of escalating trade wars and an already weakened global economy. Risk-averse behavior can reignite emerging markets woes through currency fluctuations and capital flight. In turn, these forces would reach the real economy through deteriorated confidence and income channels.
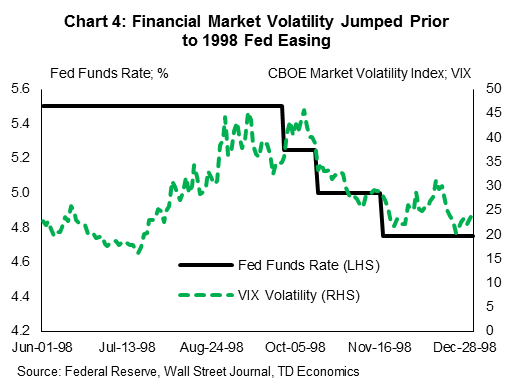
Here is the situation that led to a series of cuts during 1998. That summer, volatility spiked and stock markets declined precipitously over the course of a month, with the S&P 500 losing almost 20% of its value (Chart 4). At the same time, yields on long-term U.S. government debt plummeted, with movement concentrated at the long-end that swiftly compressed the entire curve.
The decline in financial market sentiment was largely due to events abroad – the Asian financial crisis, which began in 1997 was still fulminating and was joined in August 1998 by the Russian debt crisis. In the same month, Moody’s Investment Services threatened to downgrade Japan’s bond rating.3 Flight to safety caused the trade-weighted U.S. dollar to rise by over 20% from the beginning of 1997.
Domestic economic data began to show some cracks, but nowhere of the magnitude of the mid-1990s. However, inflation slowed with core CPI at just 2.2% and falling energy prices pulling down headline inflation to just 1.7%. The Fed’s expectation that a tight labor market would put upward pressure on inflation had failed to materialize (much like we see today).
In response to the international storm clouds, the Fed employed the first of three 25 basis point insurance rate cuts in September of 1998. This first cut helped to initially shore up market confidence, but lacked staying power. By early October, the S&P 500 had returned to within a hair of its pre-rate cut nadir and the yield curve went briefly negative. The carnage was enough for the Fed to announce a rare intermeeting 25 basis point cut in October (less than three weeks after the first one). Analysts expected the Fed would cut rates again when it met officially in November, and it did exactly that, bringing the fed funds rate to 4.75%. This was enough to stabilize financial market sentiment and thwart the threat of strong negative wealth effects passing through the economy and, eventually, undermining real economic activity. By June of the following year, the Fed regained the confidence to hike rates again.
Financial conditions matter
Fast forward to today and we find some similarities that could prompt the Fed to ease policy under a deteriorating global landscape. But, it would likely require an acute and sustained deterioration in financial market conditions on escalating trade disputes that threaten the health of the American economy. Cutting the policy rate on subdued inflation dynamics alone seems like a long shot, absent other transmissions from global and domestic strain.
In some ways, we already saw a glimpse of the Fed’s reaction function at the start of the year, with its pivot to patience following the deterioration in financial conditions in late 2018. In response to this shift in Fed communication, financial conditions improved dramatically, with stock prices rallying and corporate bond spreads narrowing.
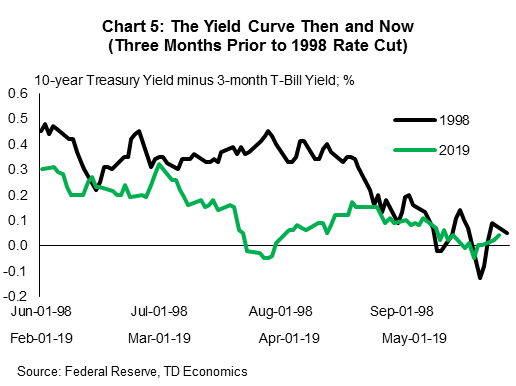
However, without rate cuts, the yield curve has remained on the cusp of inversion, with the spread between 3-month T-bills and 10-Year Treasuries flirting with negative territory on any given day. Should a second wave of trade-related fears sweep over financial markets, the impact could be both a steep sell off in equity markets, rise in risk spreads and a yield curve that moves further into inversion territory than it did in 1998 (Chart 5). Should this take place, in an environment of soft inflation (as in 1998) the Fed may indeed decide the balance of risks warrants some insurance via a cut to interest rates.
Bottom line
The two periods of insurance cuts in the 1990s may not predict exactly how the FOMC will respond to changing economic conditions today, but they do provide examples of the Fed’s reaction function and the circumstances that could lead to a change in policy stance.
As in the 1990s, debates about the level of economic slack and the seeming disconnect between a tight labour market and soft inflation remain as pertinent as ever. Perhaps the most notable difference on this front is that at that time lower inflation was viewed as a positive rather than a sign of failure.
Ultimately, the data to-date does not meet the bar for the Fed to move off its current patient stance. With respect to data, economic growth is still running above FOMC members’ long-term (trend) assumptions, the unemployment rate is a hair away from historical nadir and the job market has shown few signs of slowing down. Inflation excluding food and energy has slowed, but other core measures have been much more stable around the Fed’s (now explicit) 2% target.
While the bar is high for a rate cut, the outcome cannot be dismissed given the asymmetric risks created by escalating trade tensions and a weaker economic backdrop (both global and domestic) relative to a year ago. A test of market confidence that places the economy at risk could move the notion of insurance cuts from the history books to the playbook.
End Notes
- The year-on-year change percent change in the PCE price index excluding food and energy.
- Deflated by core PCE deflator.
- http://money.cnn.com/1998/07/23/markets/marketwrap/


