
Executive Summary
Some analysts now criticize the Fed’s December 2018 rate hike as a “policy mistake”.1 In our previous three reports, we developed a framework to analyze the Federal Open Market Committee (FOMC) and private sector forecast behavior.2 In this report, we use the same framework to analyze whether the committee’s December 2018 monetary policy rate decision was overly restrictive and inconsistent with its forecasts. The Fed previously stated it would take a “data dependent” approach to setting policy, or rely on incoming data to reveal where the economy is at the time of each FOMC meeting relative to its goals. With this in mind, we evaluate the economic projections compared to the FOMC’s federal funds rate forecast projections released at the year-end FOMC meeting. We also introduce an alternative method, in which we examine the gap between the federal funds rate forecasts and the Fed’s economic data projections. Our analysis suggests that the FOMC’s December 2018 rate hike seems to have been overly restrictive and inconsistent with its economic forecast.
A Theoretical Framework to Evaluate the Cost of Forecast Error
In the previous three reports, we used a theoretical framework to evaluate the FOMC’s forecasts and answer the question of over-optimism, and used the same framework to evaluate the private sector (Blue Chip consensus). In practice, forecasts do not always hit their targets, meaning there may be room for error. The total cost of forecast errors can be divided into an under-forecast, where the forecast is lower than the actual value, and an over-forecast, where the forecast is higher than the actual value. This leads us to the question of whether the cost of under-forecasting is identical to the cost of over-forecasting, known as a symmetric loss function. In this case, the forecaster is indifferent between under- and over-forecasting. Conversely, an asymmetric loss function has the potential to dictate a preference for forecast errors. If the forecaster knows that under-forecasting could cause more damage than over-forecasting, they may tend to over-forecast. We have previously suggested that the loss function was asymmetric.
We use the same method to evaluate whether the Fed’s monetary policy stance was overly restrictive (or accommodative) and inconsistent (or consistent) with its near-term economic forecasts. In theory, if the FOMC forecasts GDP growth and inflation to rise, a tight monetary policy stance should be implemented.
Was the FOMC’s Policy Overly Restrictive?
Some analysts now criticize the Fed’s December 2018 rate hike as a “policy mistake”. 3 Notably, James Bullard, president of the St. Louis Federal Reserve Bank, was the first Fed official to suggest the central bank made a mistake with the December rate hike. He suggested that the rate increase pushed monetary policy into a restrictive setting and put downward pressure on inflation.
Forecast Analysis
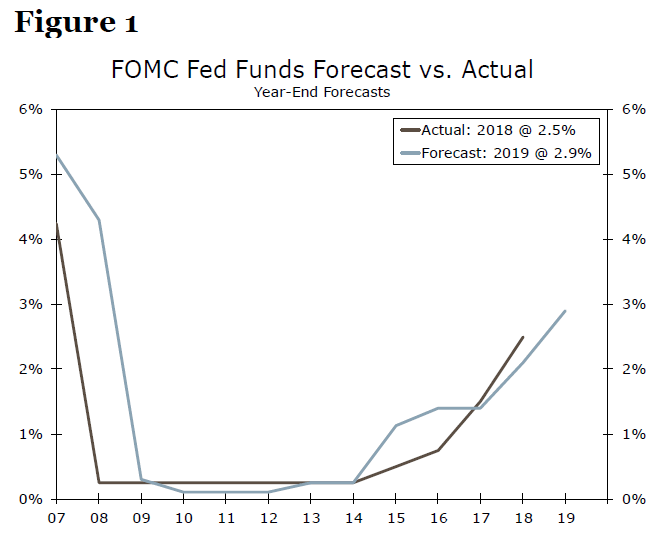
In our past work we used FOMC forecast data dating back to 1992, however, in this report we focus on the post-Great Recession era. We examine historical GDP growth, inflation and unemployment rate forecast data compared to the federal funds target rate forecast from the FOMC’s Greenbook/Summary of Economic Projections (SEP) as well as the actual rate.4
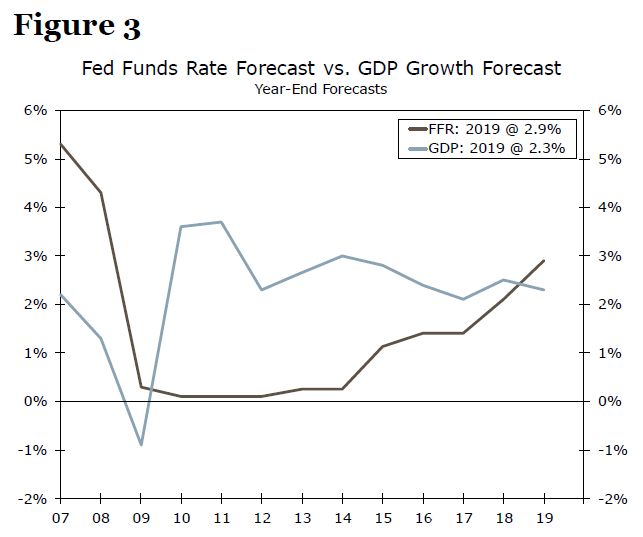
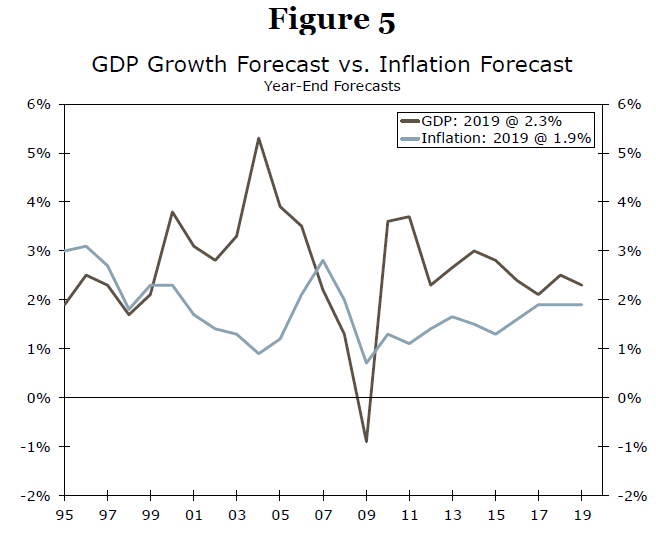
We use forecast data since 2006, but we start our analysis in 2009 to analyze if the committee’s monetary policy forecast was consistent with its growth forecasts, assuming external factors, such as trade tensions, are embedded within the forecast. In 2010 and 2011 GDP was forecast to climb 3.6% and 3.7%, respectively, while the fed funds rate was forecast to remain unchanged (median forecast of 0.1%) (Figure 3). The Fed may have followed an accommodative policy, rather than the expected restrictive policy during this period due to painfully slow growth lingering from the Great Recession, low inflation and an expected pick-up in the unemployment rate (Figure 4). The FOMC also introduced several rounds of quantitative easing (QE) during this period to jump start the recovery. In 2012, we find that GDP growth was expected to slow to 2.3% while the policy rate was held steady. The central bank’s decision to hold rates steady in an environment with decelerating growth likely stemmed from lingering uncertainty regarding the depth of the Great Recession.
In 2015-2017 GDP growth was expected to remain between 2-2.5%, while the fed funds rate was forecasted to rise 1.25 percentage points. The FOMC’s rate decision may have been influenced by rising inflation expectations, an above-average trend in the GDP growth forecast and/or a declining trend in the unemployment rate. Overall, the Fed’s monetary policy stance in 2009 through 2017 seems consistent with the FOMC’s economic projections.
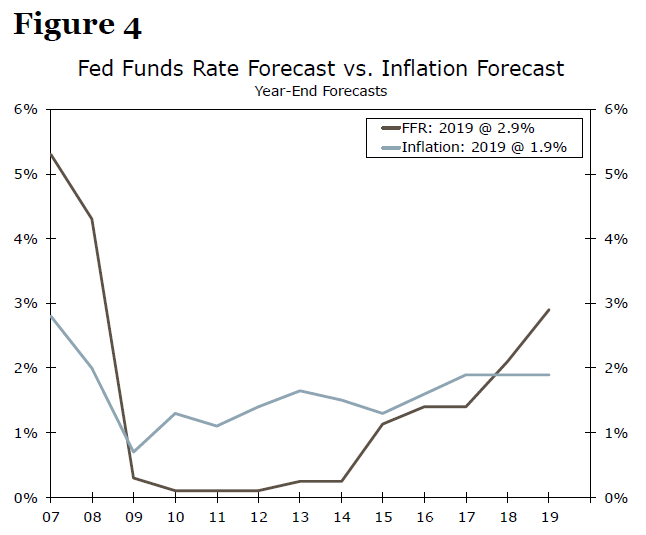
The SEP released in December 2017 forecast GDP to rise 2.5% in 2018 after rising 2.1% in 2017, inflation to remain flat at 1.9% and the fed funds rate to rise to 2.1% (median estimate) from 1.4%. The Fed’s restrictive monetary policy in 2018 may have been justified by the relatively stronger growth forecasts. Meanwhile, the SEP released in December 2018 forecast softer GDP growth and steady inflation, at 1.9%, but estimated the fed funds rate would rise to 2.9% from 2.1%. In theory, the rising fed funds forecast is inconsistent with muted inflation, which never hit the Fed’s 2% target, and lower GDP growth forecasts. Therefore, our analysis suggests that the December 2018 rate hike may have been overly restrictive and inconsistent given the FOMC’s economic and fed funds rate projections for 2019.
Gap Method to Analyze Inconsistent and Overly Restrictive Behavior
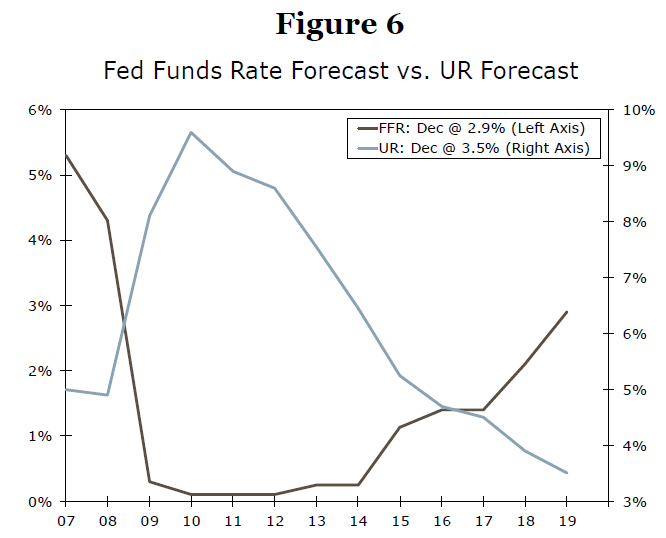
Next we introduce an alternative method, in which we examine the gap between the fed funds rate forecasts and the Fed’s economic projections. In order to help us characterize the FOMC’s forecast behavior. A wider gap between GDP growth/inflation and the fed funds forecasts is typically associated with accommodative policy, while a narrow gap suggests policy normalization. The gap’s magnitude represents the potential change in monetary policy. Shown in Figure 3 and Figure 4, the gap widened from 2009-2015. During this period the federal funds rate bottomed, reaching the nominal lower bound (0.00%). Rather than adjusting the fed funds rate, the Fed introduced QE in an effort to stimulate the economy. Thus we assume a widening gap correlates with monetary easing, while the narrowing gap in 2015-2018 represents policy normalization. In 2018, the gap turns negative for the first time in the post-Great Recession era, as the fed funds rate was forecast a higher rate than GDP and inflation growth. With GDP growth trending downward and inflation flat, below the Fed’s 2% target, the negative gap suggests forecast inconsistency.
Recently, the Fed has given a strong signal of a potential rate cut, which may widen the gap again. Historically, we see changes in the Fed’s behavior (i.e. over-optimism) when the gap widens. This means that when the gap widens, the Fed tends to be overly optimistic, while the narrowing of the gap encourages the Fed to introduce stimulus measures and be less optimistic. Even though we do not have a fed funds forecast readily available from 2002-2004, the Fed’s decision to cut rates during the period was consistent with its forecast for inflation to trend lower and for GDP growth to trend higher (Figure 5). In 2010-2012, the gap between the fed funds rate forecast and GDP growth and inflation widened significantly. During this period the FOMC was overly optimistic. We also see a similar trend in 2017 and 2018 when the gap began to narrow, as the Fed changed its behavior and began to be less optimistic.
FOMC’s “Patient” Pivot
In late 2018, the FOMC suggested that the economy was moving more consistently with the Fed’s dual mandate objectives, decreasing downside risk. Thus the FOMC’s decision to adopt a “patient” stance in early 2019 did not come as a surprise to most market participants. In light of headline and core inflation slipping in the first quarter, the FOMC’s pivot to a “patient” stance was justified. In our view, the Fed’s decision to hike rates in December 2018 was inconsistent and seems to have been overly restrictive given the SEP for 2019 suggested a gradual slowdown in growth.
APPENDIX
Our analysis uses historical data from the Fed’s Greenbook and the FOMC’s Summary of Economic Projections (SEP). As the FOMC did not begin publishing the SEP until 2012, we use the forecasts complied by the Fed in the Greenbook and given to the FOMC ahead of each meeting as a proxy for the FOMC’s forecasts from 1992-2012. Our three variables of interest are GDP growth, inflation and the unemployment rate.
For each variable, we take the one-year ahead forecast published in the December Greenbook/SEP of the prior year. For example, we use the December 1991 Greenbook to get the full-year 1992 forecast. For GDP growth, both the Greenbook and the SEP calculate the annual growth rate as the change from the fourth quarter of the prior year to the fourth quarter of the given year.
While we only have limited readily available fed funds rate forecasts, we use the Greenbook forecasts as a proxy for the FOMC’s forecasts from 2006-2012. Once the FOMC began publishing the SEP in 2012, we use the median year-ahead forecast from the December “Dot Plot,” which displays the fed funds rate projections of FOMC members.
Although in our report we mainly highlighted our evaluation of the relationship between the fed funds rate forecast and the GDP growth and inflation forecasts, we acknowledge the unemployment rate forecasts are also consistent with our overall conclusion. Shown in Figure 6, the gap between the fed funds rate and the unemployment rate also widened in the past year.
1 Saphir, Ann. “Fed at ‘end of road’ on rate hikes, Bullard says”. January 10, 2019.
2 Please see “Is the FOMC Overly-Optimistic?” Published on July 31, 2018, “Is the FOMC or the Private Sector More Optimistic?” Published on August 28, 2018, “Is the FOMC or the Private Sector More Consistent?” Published on October 17, 2018.
3 Please see footnote 1 for more details.
4 For more detail about the data used in our analysis, please see the appendix of this report. We analyze if the Fed’s monetary policy forecast was consistent with its growth forecasts.


