The US dollar index gained after the market received important data from the United States. In November, building permits rose to 1.48 million while housing starts rose to 1.365 million. This was the highest gain in more than 12 years and signalled that the housing market was strong. This has been helped by historically low mortgage rates. JOLTs job openings increased from 7.03 million to more than 7.26 million while IBD/TIPP economic expansion rose from 52.9 to 57.0. Meanwhile, manufacturing production and industrial production rose by 1.1%. This was better than the expected decline of -0.7% and -0.9%.
The Japanese yen gained after the markets received important trade data. In November, exports declined by -7.9% while imports declined by -15.7%. As a result, the trade deficit increased to more than $82 billion. The Japanese economy has been struggling as a result of the trade wars between China and the US, and between Japan and South Korea. The economy has also struggled because of a tax hike that went into effect in October. In response to this weakness, Shinzo Abe announced a new $121 billion stimulus to boost the economy. The Bank of Japan will deliver its rates decision on Thursday.
It will be a busy data-day for the markets. In Europe, the market will receive the producer price index and wholesale prices for November. German survey data will also be released. Sweden will release consumer confidence and manufacturing confidence data. In the United Kingdom, the market will continue to get more information on Boris Johnson’s Brexit plans. In addition, the Office of National Statistics (ONS) will release the CPOI and PPI data. Eurostat will also release the CPI data for November. Meanwhile, in Canada, the market will receive the CPI data for November. In the United States, the EIA will release energy data.
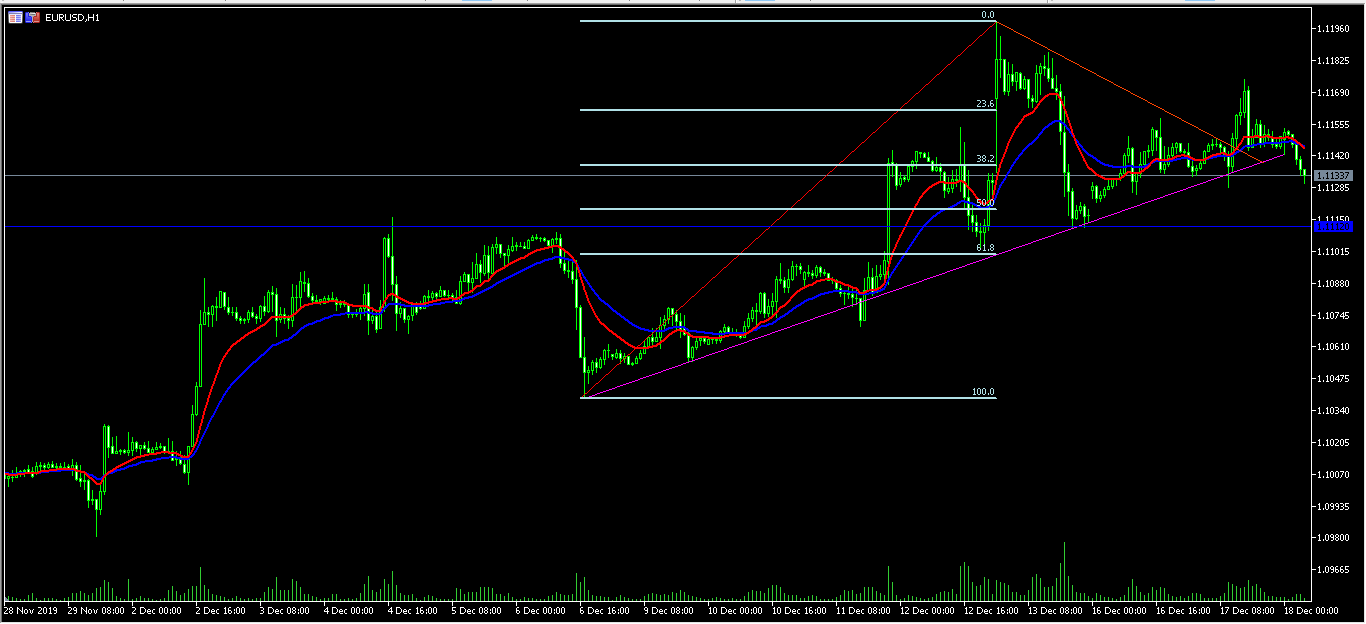
EUR/USD
The EUR/USD pair declined after strong housing data from the United States. Before the data, the pair had moved above the upper line of the triangle pattern. This turned out to be a false breakout. The pair is trading at 1.1135, which is slightly below the 14-day and 28-day moving averages. The pair may continue moving lower to test the 50% Fibonacci Retracement level of 1.1120.
USD/JPY
The USD/JPY pair formed a triple bottom at 108.42 and then started to rally. It reached a high of 109.71 on Friday. The price then declined and is now trading at 109.44. On the hourly chart, the price is slightly below the 14-day and 28-day moving averages while the RSI had been moving lower. The dots of the Parabolic SAR are slightly above the current price. The pair may continue moving lower as the markets wait for the BOJ decision.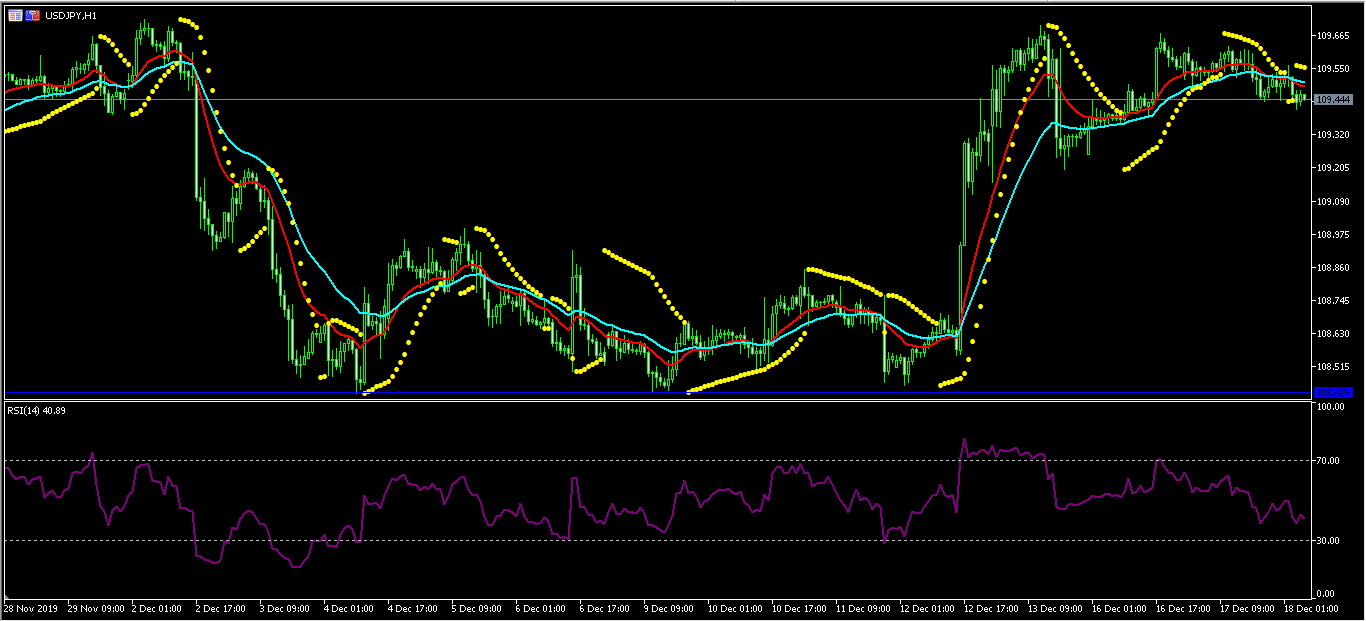
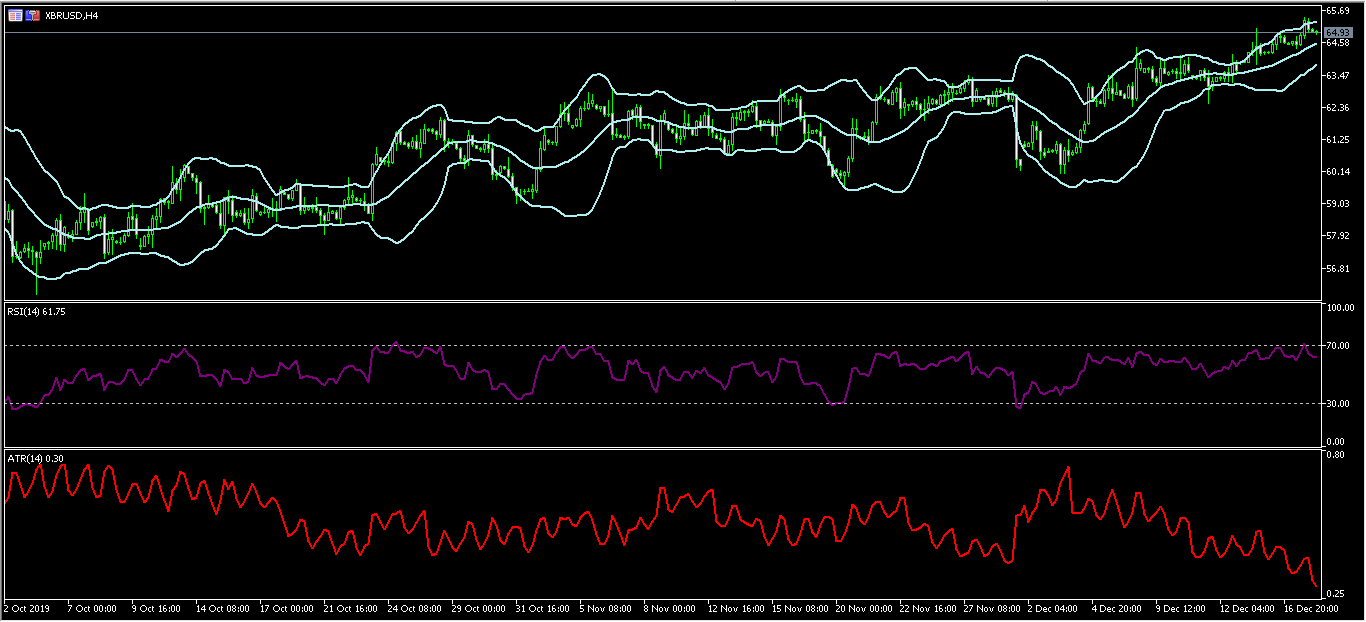
XBR/USD
The XBR/USD pair declined after API released the inventory data for the past week. The pair dropped from a high of 65.45 to a low of 64.95. On the four-hour chart, the price has been moving upwards as shown below. The price is slightly below the upper line of the Bollinger Bands. The RSI has remained slightly below the overbought level of 70. The Average True Range (ATR) indicator has been falling, which is a signal of low volatility. The pair may remain at the current level ahead of the EIA data.