
European growth forecasts on tap
The European Commission is scheduled to release its economic growth forecasts for the region today, and those will likely determine the direction for the Euro in the near term. While data has been showing some improvement over the past few months, Brexit and now the coronavirus outbreak are factors which could prompt a less-optimistic outlook.
Ahead of the release we will hear speeches from ECB’s Lagarde and De Guindos. Let’s see if they are all on the same wavelength.
Coronavirus update
Fitch Ratings came out and stated the obvious early this morning by highlighting that the coronavirus outbreak would damp China’s economic growth this year. It stated that the extent of the impact remains uncertain, depending on the duration and intensity of the health crisis, and so did not give any revised forecasts.
The latest data on the coronavirus showed a spike in numbers overnight to 28,296 cases currently, with 565 associated deaths. The deaths remain primarily in mainland China, with still the one in the Philippines and one in Hong Kong the only reported deaths outside the Chinese borders (Source: John Hopkins University).
We are approaching the time when the 14-day period of the first city lockdowns expires and many are hoping to see a tailing off in the number of new cases and deaths to prove that containment and isolation is helping to curb the virus’s spread. If that isn’t the case, then we could see a reversal in the risk-positive activity.
Oil extends gains
The better-than-expected US data yesterday helped the rebound in oil prices yesterday, with ongoing fears about OPEC production cuts to stem the oil price decline adding to the mix.
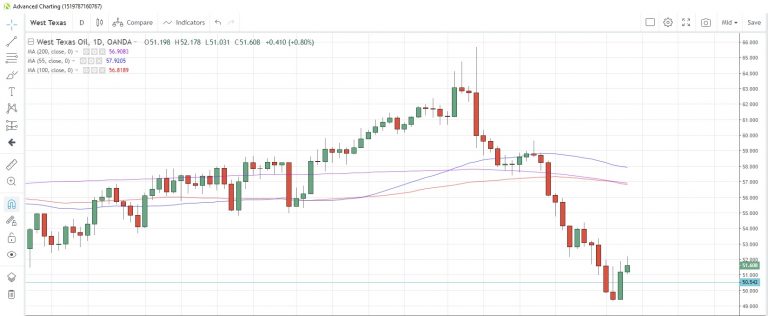
West Texas Intermediate (WTI) jumped the most in two months yesterday, rebounding from 13-month lows, and extended gains into today which saw prices hit the highest this week.
Weekly oil stockpiles data from the Energy Information Administration showed an increase of 3.36 million barrels in the week to January 31. It was more than the surveys suggested, but below the previous week’s level of +3.55 million barrels.
WTI Daily Chart
Minor US data flows
Q4 unit labour costs and nonfarm productivity fill up the US calendar along with a speech from Fed’s Kaplan. Labour costs are seen easing to +1.3% from +2.5% in Q3.


