US stocks had their fifth-worst day on record as traders continued to worry about coronavirus and the central banks’ response. The three main indices declined by almost 10% in their worst day since the 1987 flash crash. The decline came after Donald Trump banned flights from the European Union. It also came after the ECB announced new measures to accommodate the economy. The bank said that it will pay banks to lend money and increase its quantitative easing program. Meanwhile, the Federal Reserve said that it would pump trillions of dollars into the financial system in an attempt to ease short-term funding. The New York Fed said that it would increase the size of its lending in the repo market.
The price of gold declined sharply during the American and Asian sessions. This was a surprising move because gold is often seen as a safe haven where investors run to when market risks increase. Analysts blame several factors for the price action. There are some who believe that the price is falling because central banks are selling their holdings to deal with the coronavirus. Others believe that gold is dropping because of low demand among the buyers.
Today, it seems like the market selloff will continue. Futures tied to the Dow, Nasdaq, and the S&P500 have dropped by more than 2%. The same trend is happening in Europe, where futures tied to the CAC and FTSE have dropped by more than 10%. In Asia, the Nikkei, KOSPI, and Shanghai have dropped by 8%, 7.30%, and 2.50% respectively. In addition, we will receive inflation data from Europe and import and export price index data from the US. These numbers, while important, will likely mean little to the market.
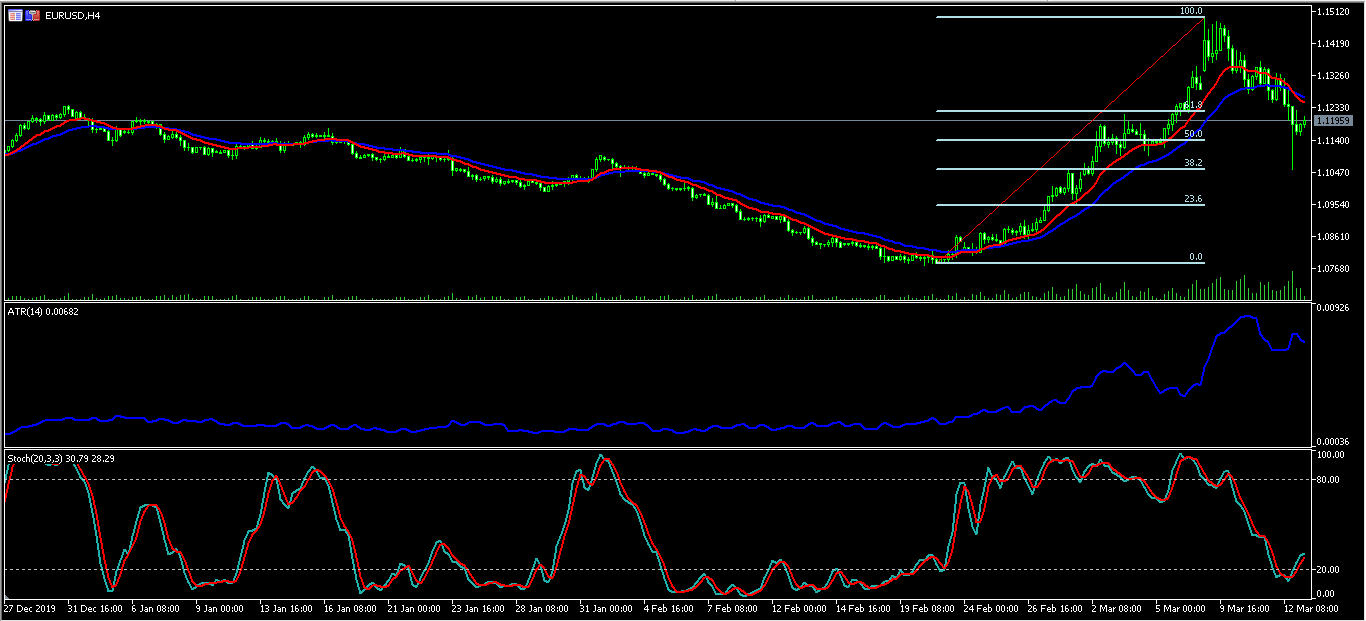
EUR/USD
The EUR/USD pair declined to an intraday low of 1.1055 in the American session. The pair recovered during the Asian session and is now trading at 1.1200. The price is a few pips below the 61.8% Fibonacci Retracement level and below the 14-day and 28-day EMAs. The average true range has continued to rise while the Stochastic Oscillator has moved from the oversold levels. The pair may continue to make big moves as traders reflect on news from both sides of the Atlantic.
XBR/USD
The XBR/USD pair declined to an intraday low of 33.63 as the mood in the market dampened. The price is below the 14-day and 28-day exponential moving averages while the RSI is slightly above the oversold level of 30. The Chaikin oscillator has dropped below the centreline while the dots of the Parabolic SAR are above the price. This means that the price may continue moving lower to test Monday’s low of 31.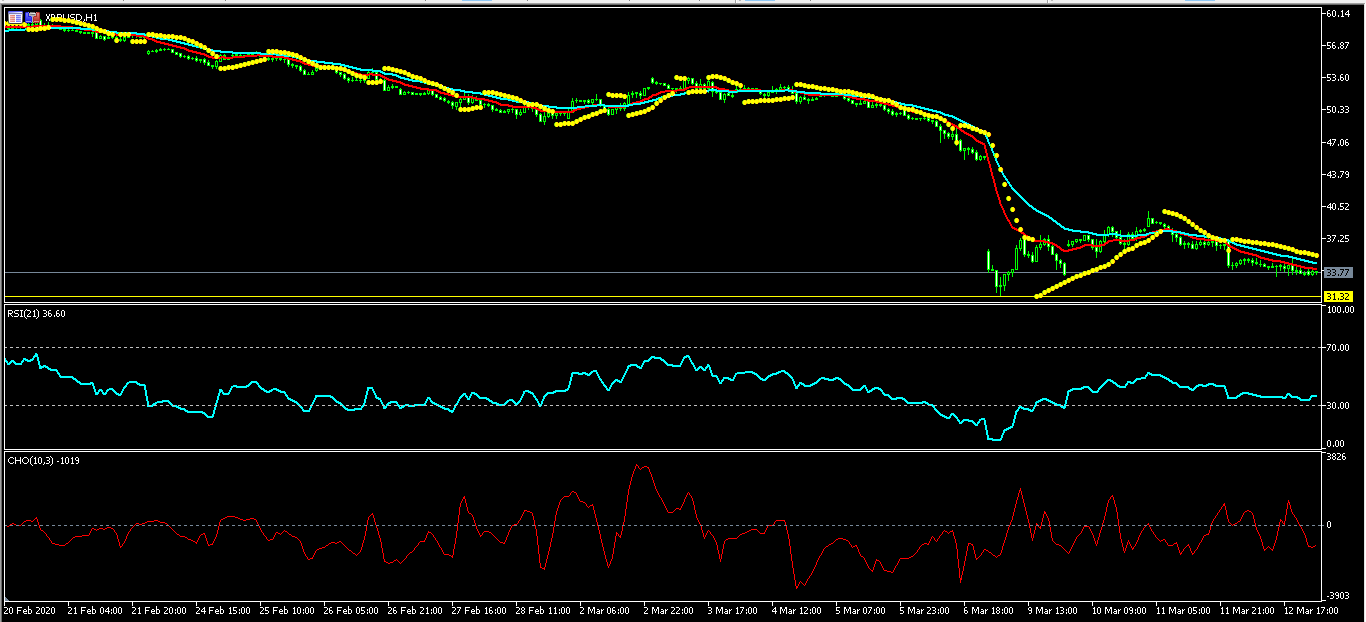
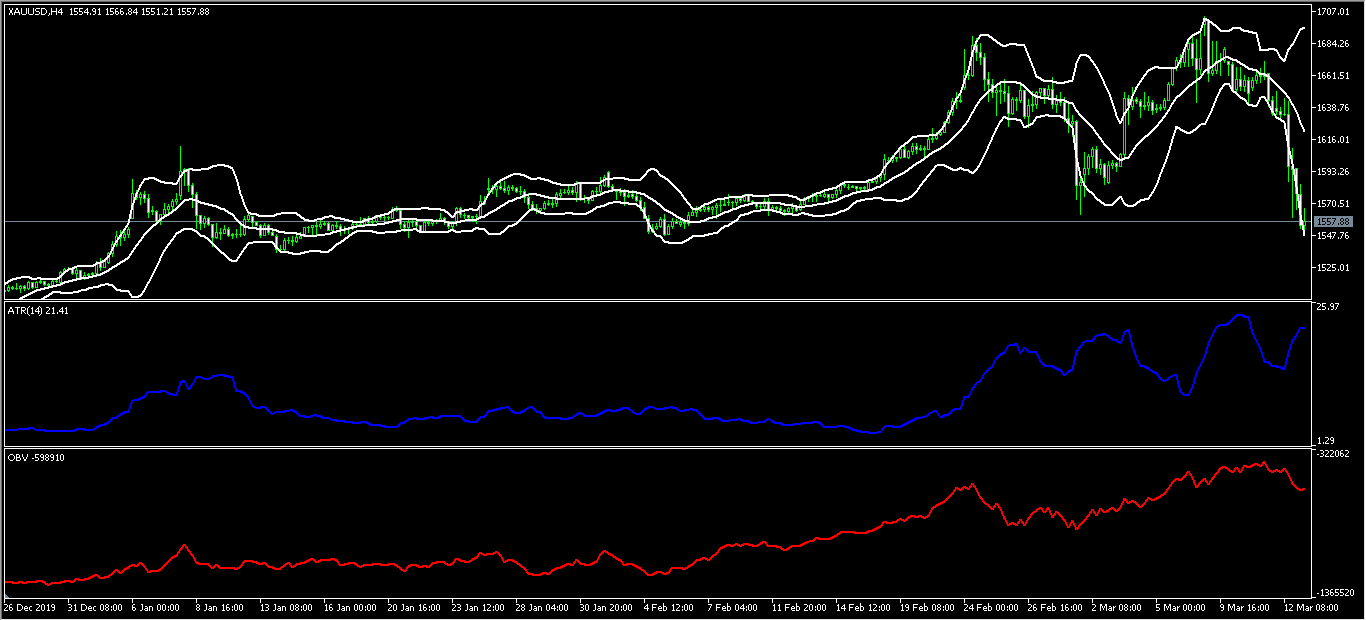
XAU/USD
The XAU/USD pair dropped to an intraday low of 1,550, which was the lowest level since February 7. On the four-hour chart, the price is along the lower line of the Bollinger Bands. The average true range indicator has risen while the on-balance volume has continued to move lower. The price of gold may continue moving lower on demand reasons.