
U.S. Highlights
- The S&P 500 is on track to end the week flat, erasing some earlier momentum as economic data and earnings reports released throughout the week revealed the extent of the pandemic’s impact.
- The U.S. economy contracted by 4.8% annualized in the first quarter, ending the longest economic expansion in its history. The stage is set for an even steeper decline in the second quarter due to longer and broader shutdowns.
- The Federal Reserve left its policy rate unchanged at the 0 to 0.25 percent target range this week. It reaffirmed its ongoing commitment to support the economy.
Canadian Highlights
- Several provinces announced strategies to reopen their economies this week. Policy makers will have to tread carefully as new pandemic cases and deaths remain elevated.
- Oil prices remain weak and volatile. Excess supply and limited storage continue to cast a dark cloud over the oil market.
- Small business sentiment in April improved nationally, but stark differences remain across provinces.
U.S. – COVID-19 Ends the Longest Expansion in U.S. History
Financial markets erased some of their earlier momentum this week as economic data and earnings reports released throughout the week showed the pandemic’s impact. As of writing, the S&P500 is on track to end the week flat. The index ended a turbulent month of April up by 12.7%, but is still down about 10% on the year.
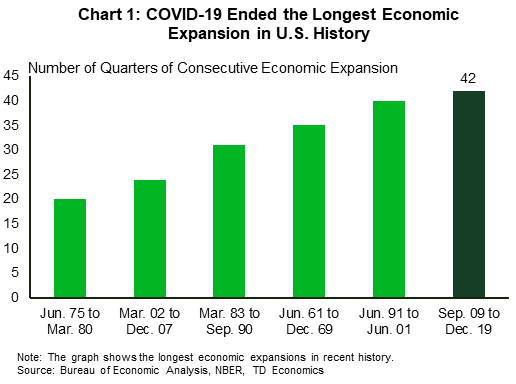
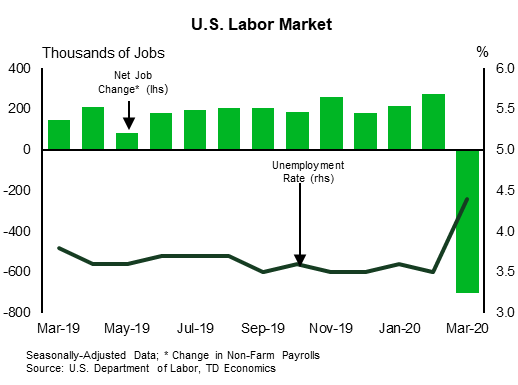
As the number of COVID-19 fatalities breached 60,000 in the U.S., the devastating impact of the pandemic was on full display in economic data released throughout this week. First quarter GDP contracted by 4.8% annualized, ending the longest economic expansion in the history of the United States (Chart 1). The details were as stark as the headline number suggests, with a contraction in personal consumption expenditures and non-residential fixed investment the biggest drags on GDP. Bucking the trend was residential investment, which advanced by 23.5% annualized as a spell of unusually warm weather helped to lift construction activity at the outset of the year. The stage is set for a steeper GDP decline in the second quarter, considering that shutdowns only went into full effect around mid-March.
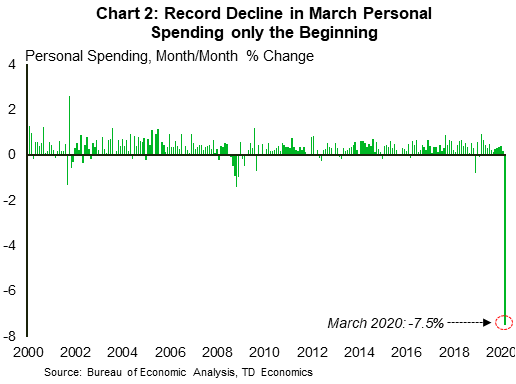
The hit to consumer spending, which represents roughly two-thirds of economic output, was even more evident in the March personal income and spending data. Personal spending declined by 7.5% month-on-month in March, the largest single-month contraction on record (Chart 2). Personal income fell by a more moderate 2%, weighed down by a decline in compensation. With over 20 million Americans filing for unemployment benefits since the beginning of April, the hit to spending will worsen in the near-term. A sliver of good news was that the number of initial jobless claims declined for the third straight week, but still topped 3.9 million last week. Looking ahead, next week’s employment data release for the month of April promises to be one for the history books, with the unemployment rate likely to be well into the double-digits.
Elsewhere, manufacturing sentiment continued to weaken in April as the ISM Manufacturing Index dove deeper into contractionary territory at 41.5. The declines were broad-based across sub-indices, with new orders, production and employment recording the largest drops. By contrast, a strengthening in supplier deliveries prevented the index from falling further. This increase, however, points to supply shortages rather than stronger demand. Going forward, an increasing number of states looking to ease virus-containment orders in the coming weeks should eventually provide a fillip to the manufacturing sector. Boeing and BMW, for instance, will be reopening their manufacturing plants on May 4 with enhanced safety protocols.
With large swaths of the economy currently in the doldrums, policymakers remain on high alert. During its scheduled policy statement this week, the Fed left the federal funds rate unchanged at 0 to ¼ percent. Importantly, it reaffirmed its ongoing commitment to support the economy. It also expanded its Main Street Lending Program by allowing larger businesses to participate and lowering the minimum-loan requirements to help more small businesses. Such continued support will be much needed to help bolster the chance of a successful economic rebound in the months ahead.
Canada – Reopening Cautiously
This was a milestone week, as several provinces announced strategies to reopen their economies. Ontario and Quebec were first out of the gate. Ontario’s exit strategy has three phases; Phase One will allow small gatherings and opening of select workplaces; Phase Two will permit the reopening of certain service industries; and Phase Three will allow the opening of all public places. No timeline was given for the phases. Quebec was more forthcoming. It will allow retail outlets to resume activity as soon as May 4, and manufacturing to resume on May 11, albeit with some restrictions. Quebec’s elementary schools and daycares will also reopen on May 11, but high schools, colleges and universities will not reopen until end-August.
Manitoba will also begin its multi-phase reopening plan on May 4. Newfoundland and Labrador will reopen starting May 11, while Alberta and PEI’s gradual relaunch plan will start today. Still, not every province is as keen to remove restrictions. British Columbia extended its state of emergency for an additional two weeks as cases continue to rise.
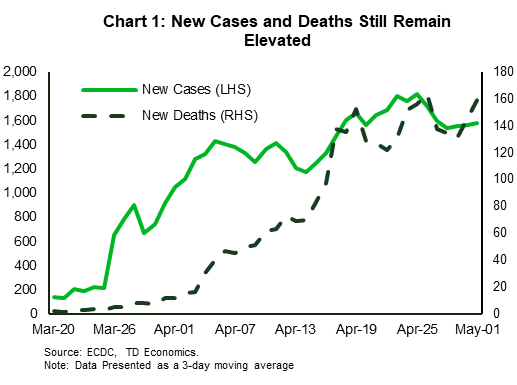
Provinces made it clear that further details on the timeline would depend on health outcomes. While allowing businesses to reopen will relieve pressure on provinces’ economies, they will need to tread carefully. New cases and deaths remain elevated (Chart 1). Provinces’ success in reopening will hinge on a consistent decrease in new cases, death rates, and hospitalizations.
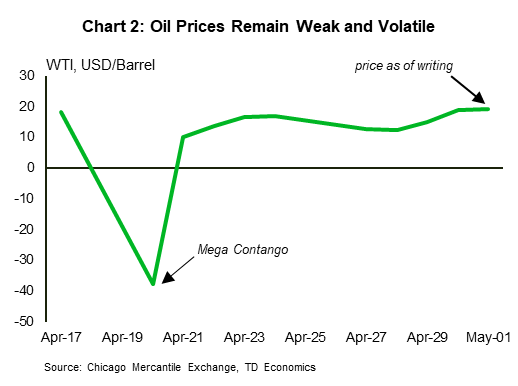
Elsewhere in markets, oil prices started this week on an erratic note. After going sub-zero last week, oil prices have moved back into positive territory (Chart 2). Still, fears of last week’s negative prices prompted major selling of the June contract led by a major exchange-traded index. Excess supply and limited storage continue to cast a dark cloud over the oil market.
In terms of economic data, the CFIB Business Barometer improved to 46.4 (up from 37.7 two weeks ago). The improvement in sentiment is likely due to government support measures that came into effect in April. However, there are two caveats to keep in mind. First, the improvement in sentiment is compared to abysmal data in the weeks prior. Second, it masks considerable regional divergence. In Quebec, Newfoundland & Labrador and New Brunswick, sentiment weakened.
The Canadian Survey of Business Conditions – a joint effort between Statistics Canada and the Canadian Chamber of Commerce – shed additional light on how businesses are dealing with the pandemic. The results are bleak; about 51% of businesses cannot operate more than 90 days without a source of revenue; 38% have reduced working hours; and 41% have laid off staff.
Finally, we have a new Bank of Canada governor. Tiff Macklem, former senior-deputy governor and dean of Rotman School of Business will replace Stephen Poloz. Macklem comes with decades of monetary policy experience at the Bank of Canada that will undoubtedly come in handy as he helms the ship through unchartered monetary policy waters.
U.S: Upcoming Key Economic Releases
U.S. ISM Non-Manufacturing Index -April
Release Date: May 5, 2020
Previous: 52.5
TD Forecast: 41.0
Consensus: 37.3
We forecast a large drop in the ISM non-manufacturing index to 41.0 in April, which would bring it to its lowest level since the financial crisis. The index remained above 50 in March (52.5 after 57.3), even as Markit’s services PMI and regional Fed indexes signaled contraction, but a sizable drop looks likely after the Markit and regional indexes fell sharply again, even with a rise in the supplier deliveries part. The March data likely mainly reflected responses received before activity began to plunge around mid-month.

U.S. Jobs Report – April
Release Date: May 8, 2020
Previous: non-farm payrolls (nfp) -701k; unemployment rate 4.4%
TD Forecast: non-farm payrolls (nfp) -25mn; unemployment rate 15.0%
Consensus: non-farm payrolls (nfp) -21mn, unemployment rate 16.0%
The recent surge in jobless claims is likely to be reflected in a plunge in payrolls and a sharp rise in the unemployment rate, even with measurement challenges potentially leading to the full degree of weakening being understated. Weakness in payrolls could be limited by some of the firms that have been shut down not responding to the BLS survey, while the rise in the unemployment rate could be limited by some job losers reporting that they have not actively been looking for a new job. However, the data will likely still be dismal. Average hourly earnings were probably boosted by mix shifts, with relatively more weakening in payrolls in low-wage than in high-wage jobs.
Canada: Upcoming Key Economic Releases
Canadian International Merchandise Trade – March
Release Date: May 5, 2020
Previous: -0.98bn
TD Forecast: -$2.9bn
Consensus: -$2.7bn
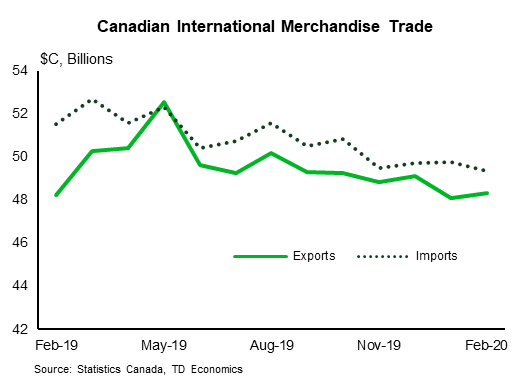
TD looks for the international merchandise trade deficit to rise to $2.9bn in March on a broad pullback in trade flows as COVID-19 and the associated decline in economic activity weighs on both exports and imports. The former should see a larger toll, due in large part to the sharp drop in energy prices, although motor vehicle exports will weigh heavily as well after automakers shut down production in late March. Preliminary production figures were down roughly 33% on the month, which would leave a $2.5bn hole in the trade balance should exports see a similar decline. However, the impact on the trade balance will be offset by a significant drop for imports. None of this bodes well for Q1 growth, but we expect the abysmal tracking from StatCan for a 9% drop in industry-level GDP already captures this weakness (and more).
Canadian Housing Starts – April
Release Date: May 8, 2020
Previous: 195.2k
TD Forecast: 80k
Consensus: 73k
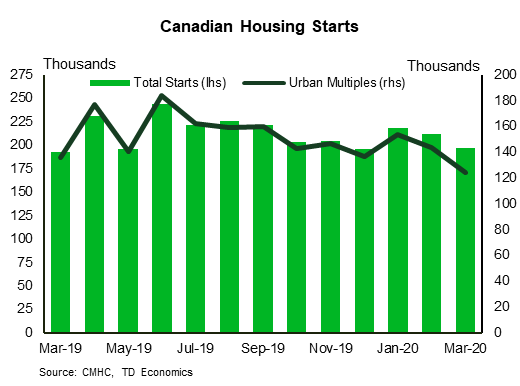
Housing starts are forecast to plummet by nearly 60% to 80k in April as COVID-19 brings residential development to a near-halt. Emergency measures led to the closure of many job sites during late March and early April, but we anticipate the absence of a complete ban on construction will allow some projects to move forward. New development will be the most impacted segment of the construction industry so while the month-over-month pullback is dramatic, we expect monthly GDP will show a more modest pullback for construction.
Canadian Employment – April
Release Date: May 8, 2020
Previous: -1.0m, unemployment rate: 7.8%
TD Forecast: -4.0m, unemployment rate: 18.2%
Consensus: -5.0m, unemployment rate: 20.0%
The April LFS will provide another barometer for COVID-19’s impact on the labour market and setting aside any uncertainty over how emergency benefit applications translate into unemployment figures, job losses will be momentous. We forecast a 4m decline for employment, which may prove conservative given 6m Canadians had applied for emergence benefits by the April reference week. However, our forecast includes an allowance for CERB applicants who are only working reduced hours, and also allows for some who were brought back from furlough by firms anticipating reimbursement through wage subsidies; companies could not apply for this program until April 27th, but payments will be retroactive to March 15th.
If realized, job losses of this magnitude would leave total employment 5m below levels from February and push the employment rate to 45.6%, roughly 10% below the lowest month on record from 1982. This would put the unemployment rate at 18.2% despite an offsetting decline in participation. However, given the potential for a large swing in weekly hours, we will be equally focused on total hours worked to calibrate the implications for Q2 growth.


