
- All items CPI fell to 0.3% year-over-year in April
- Largest monthly decline (-0.8%) since December 2008
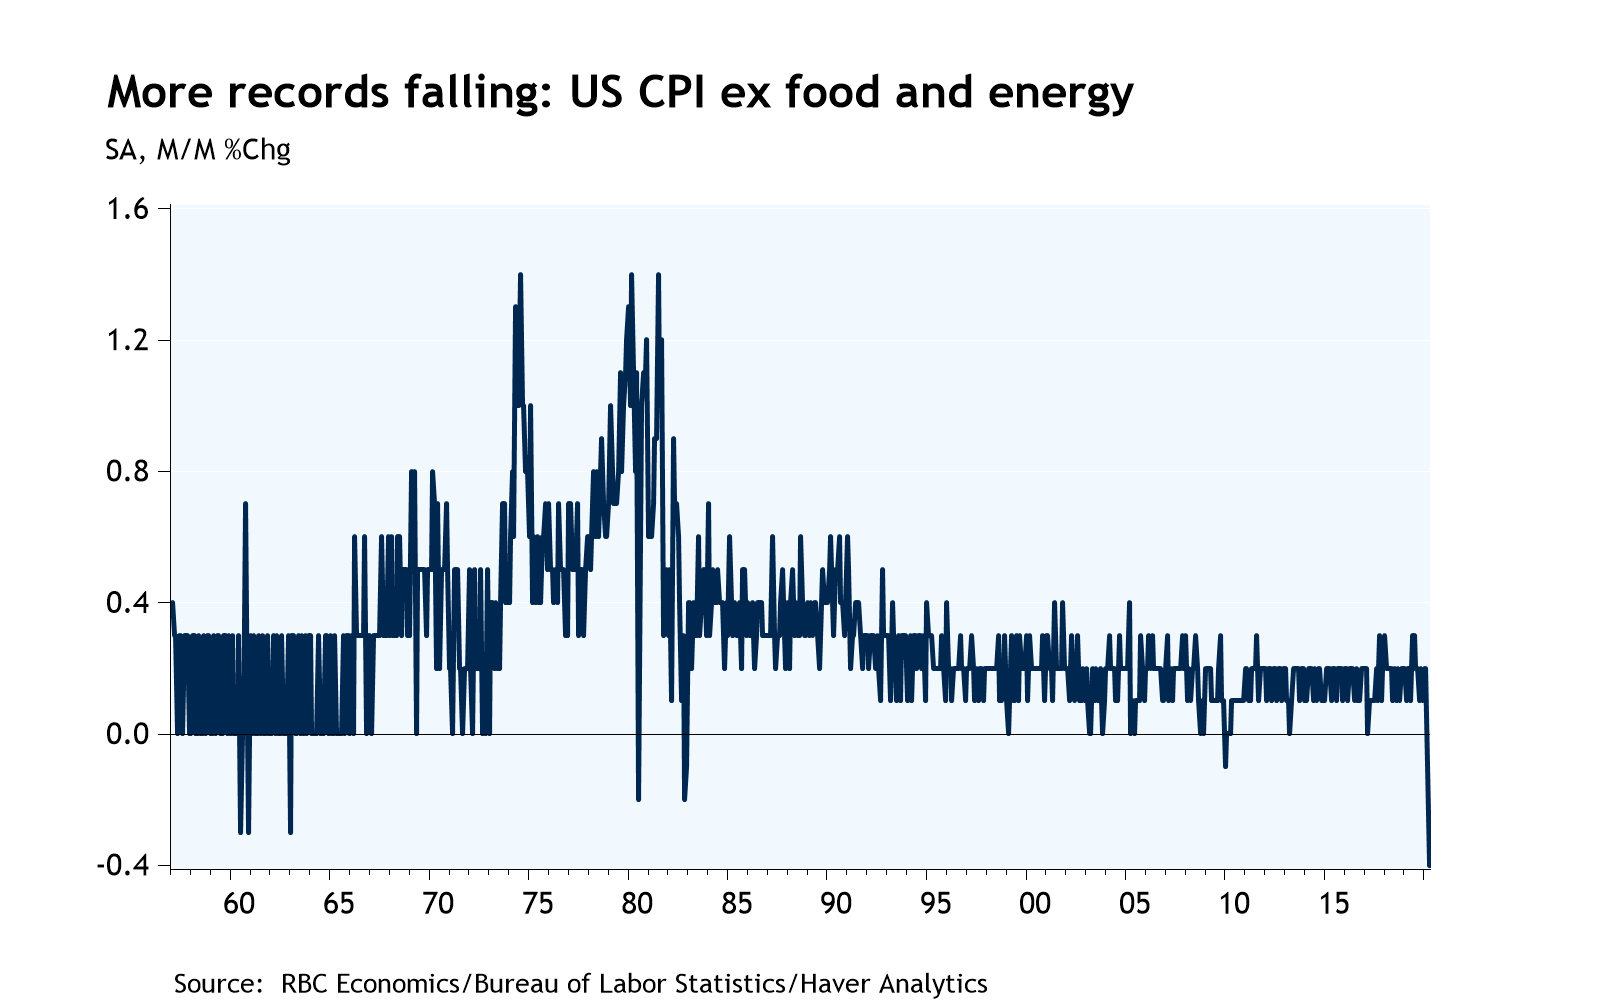
- Ex food and energy index posts record monthly decline; slows to 1.4% year-over-year
CPI inflation slowed sharply in April with the all items index posting its largest monthly decline since the 2008-09 recession. Lower gasoline prices (-21% m/m) were a major factor, but slowing core inflation also played a role with the ex food and energy index falling 0.4% month-over-month in April. That’s the largest drop in history dating back to 1957, and reflected (among others) record monthly declines in prices for apparel, motor vehicle insurance, and airfares. While prices declined for many of the things Americans are buying less of at present, prices for “food at home” rose at the fastest monthly pace (+2.6%) since the 1970s. That’s a tough pill to swallow for the tens of millions of Americans who have lost their jobs in the past two months.
We expect inflation will decline further in the coming months with the headline rate expected to fall below zero (on a year-over-year basis) in Q2 and Q3. That would exceed the slowdown seen during the 2015-16 oil price shock, and mark the worst period of disinflation since the 2008-09 recession. Core inflation is likely to dip below 1% for the first time since the recession. The lows for inflation should come this year, but we think it will be a while before the Fed is able to hit its 2% inflation objective on a sustained basis. Even with a gradual re-opening of the economy spurring a rebound in growth over the second half of the year, we expect some demand weakness will persist through 2021. That should keep a lid on inflation, and keep the Fed in stimulus mode for an extended period.
Note: With COVID-19 containment measures making CPI data collection difficult, the BLS noted “many indexes are based on smaller amounts of collected prices than usual.” The release didn’t single out any specific categories as potentially being less accurate than normal.


