
Executive Summary
If history is any guide, the economic weakness stemming from COVID-19 should put downward pressure on rates of consumer price inflation. Indeed the year-over-year change in the consumer price index slid in April to its lowest rate since 2015. Some observers worry that the U.S. economy could be on the cusp of deflation, which is a sustained decline in the economy’s overall price level. Although consumer price inflation is set to slow this year, the U.S. economy should skirt outright deflation. In this report, we discuss downside risks to our inflation outlook.
Deflation or Disinflation?
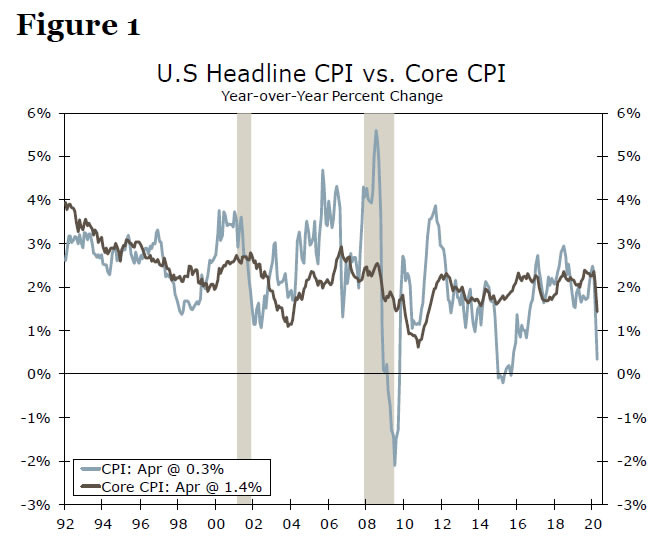
The steps taken to combat the spread of COVID-19, specifically the stay-at-home orders that have shuttered many businesses, are leading to significant weakness in economic activity. As we discuss in our recent Monthly Economic Outlook, we look for real GDP, which fell at an annualized rate of 4.8% in Q1-2020, to nosedive 25% in Q2 and for the unemployment rate to average 17.6% during the quarter. If history is any guide, this economic weakness should put downward pressure on rates of consumer price inflation. Data released on May 12 show that overall CPI inflation fell to 0.3% in April, the lowest year-over-year rate since 2015 (Figure 1). The “core” CPI, which excludes volatile food and energy prices, tumbled 0.4% in April, the largest month-on-month decline on record. On a year-ago basis, core CPI inflation slipped to 1.4%, the lowest rate in nine years.
Some observers worry that the U.S. economy could be on the cusp of deflation, which is defined as a sustained decline in an economy’s overall price level. We look for the overall rate of CPI inflation to dip to 0.2% by year-end, due, at least in part, to the sharp drop in energy prices that has occurred in recent months. We also look for the core rate of CPI inflation to recede to 0.9% due to generalized weakness in pricing power stemming from the sharp downturn in economic activity. But could we be wrong? Could inflation rates drop even further than our forecast projects? Could the U.S. economy slip into outright deflation?
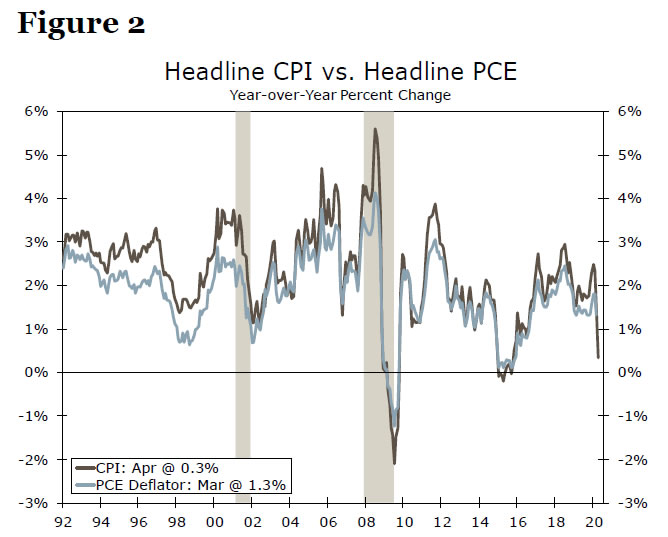
Before we turn to an in-depth discussion of different potential sources of deflation, let’s first discuss consumer prices in general. First, there are two measures of consumer price inflation in the United States that analysts generally use: the year-over-year change in the consumer price index (CPI) and the year-over-year change in the personal consumption expenditures (PCE) deflator. Because there are some methodological differences between the two indices, the latter tends to run a bit lower than the former. That said, the two rates of inflation are highly correlated (Figure 2). We focus on the CPI measure of inflation in this report.
Sources of Potential Downward Pressure on Goods Prices
Because services account for the majority of consumer purchases, services have the largest weight in the CPI. Specifically, services comprise 63% of the CPI with goods making up the remaining 37%. Drilling down further shows that food has a weight of roughly 14% and energy commodities comprise 3% of the CPI. “Core” goods (i.e., purchases of goods excluding food and energy) make up about 20% of the CPI.
Let’s start with food. Americans can either purchase food that they consume at home (7.6% weight in the overall CPI) or eat away from home (6.2% weight). So there are opposing forces on food prices at present. On one hand, the limiting of many restaurants across the country to take-out only put downward pressure on the latter, which rose a mere 0.1% in April. On the other hand, however, the necessity of buying more food in grocery stores has put some upward pressure on prices of “food at home,” which surged 2.6% in April, the largest gain in over 45 years. As parts of the economy begin to re-open, restaurant reservations have started to come back slowly, but we still expect demand at grocers to remain high until a vaccine is developed. Consequently, food prices likely will not be a meaningful source of deflationary pressure in coming months.
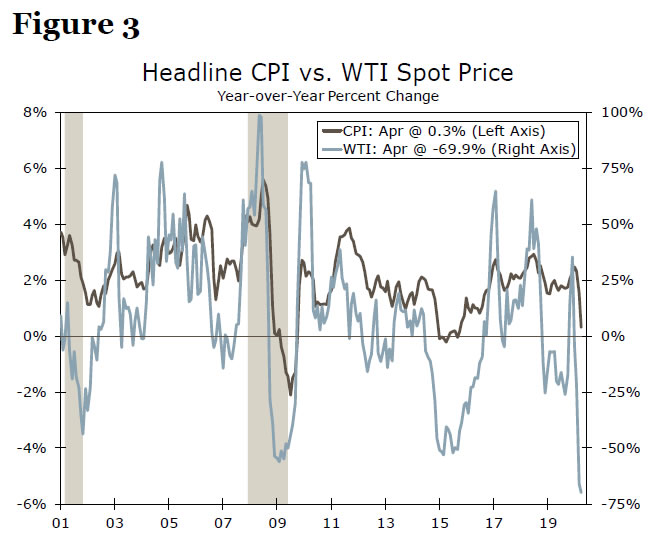
However, the recent collapse in oil prices—the monthly average price of West Texas Intermediate (WTI) plummeted by more than 70% between December and April—clearly has pushed the overall rate of inflation lower (Figure 3). Indeed, the 20.4% drop in motor fuel prices in April sliced 1.2 percentage points from the year-over-year CPI inflation rate. However, motor fuel prices account for only 3% of the CPI. Moreover, the $50/barrel nosedive in petroleum prices between December and April will not be repeated because the spot price of West Texas Intermediate (WTI) at present is only $26/barrel.
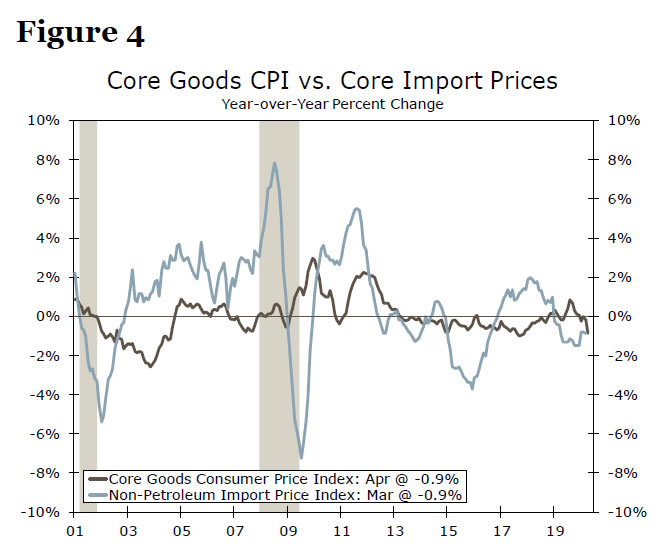
Global influences could be a general factor that could push core goods prices lower, because imports of consumer and auto goods are equivalent to roughly one-quarter of consumer purchases of goods. Not only has the pandemic dealt a crippling blow to the U.S. economy, but most other major foreign economies likely will contract meaningfully as well this year.1 Consequently, prices of goods that are produced in foreign economies and then imported into the United States could weaken in coming months. As shown in Figure 4, changes in core import prices tend to be associated, at least eventually, with changes in core goods prices. In short, import prices could be a source of some modest deflationary pressure.
Sources of Potential Downward Pressure on Services Prices
As noted previously, services account for the majority of the CPI. Specifically, “core” services (i.e., services less utility purchases) have a 75% weight in the core CPI, thus swings in core services dictate the trajectory for broader core inflation. The steps taken to combat the coronavirus have disproportionately hit the service sector. As a large portion of the United States has been under stay-at-home orders, travel demand has tumbled. Car and truck rental prices (-16.6%), airline fares (-15.2%) and lodging-away-from-home prices (-7.1%) saw record monthly declines in April. Despite the relatively small weights of these components (airfare and hotels each comprise only about 1% of the core CPI and car rentals represents a mere 0.1%), the price declines were large enough to together shave 25 basis points off of the month-on-month change in the April core CPI, or more than half of its registered record 0.448% decline.
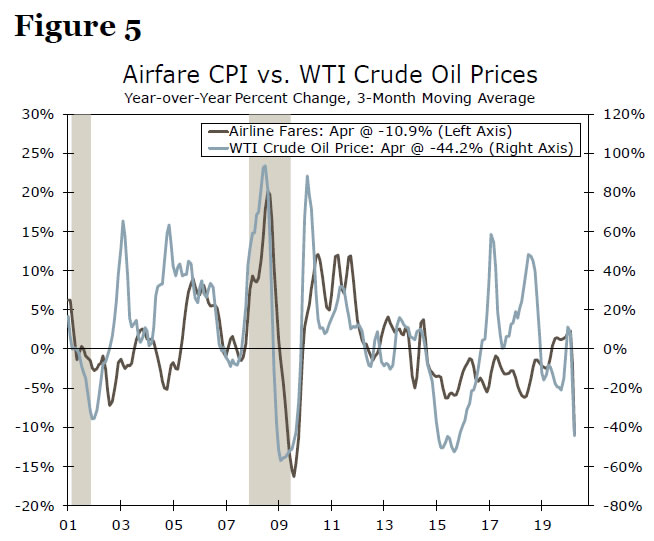
With many parts of the country beginning to re-open, airline traffic and hotel occupancy rates have started to moderately grind higher, suggesting demand is starting to come back. A full rebound in these pricing components likely will not occur until a vaccine is developed or consumers are fully comfortable traveling again, but the uptick in demand suggests prices likely will not continue to experience such steep declines. Eventually, airfare prices should start to drift higher as in-flight social distancing is imposed, causing the price per person to rise. That said, lower oil prices will help cushion airline margins and keep a lid on the eventual increase in costs (Figure 5).
Lodging-away-from-home falls into the broader shelter category of the CPI, which we would be remiss not to mention since shelter commands the highest share of the core CPI at 41% and has underpinned inflation in recent years.2 In April, overall shelter was flat as a modest uptick in rents offset the record decline in lodging-away-from-home. Housing costs may be another source of disinflationary pressure, as the record surge in unemployment weighs on housing demand as well as households’ ability to meet mortgage or rent payments.
In terms of how the CPI rent component is calculated, if rent is not paid, not expected to be paid or the landlord is unsure of when it will be paid, it is recorded as $0, which has the potential to weigh heavily on the CPI. According to the National Multifamily Housing Council, the share of renters who have paid rent through May 06, isn’t far off of last year’s levels (80.2% vs. 81.7%).
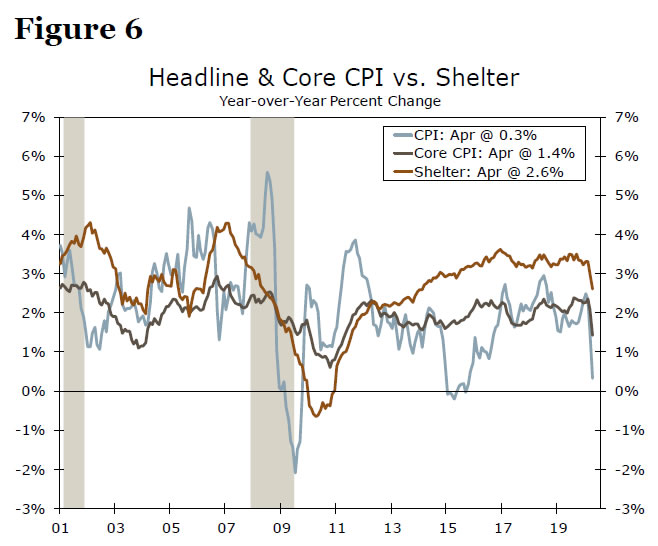
Although millions of individuals have been displaced from their jobs, we suspect that the one-time checks and the enhanced unemployment benefits, which were part of the CARES Act, have helped many households meet their rent obligations. But the longer the crisis goes on, the more likely it is this component can turn south and pull the headline index lower with it (Figure 6). Regardless, shelter should hold up better than after the 2008-2009 housing bust and help prevent prices from falling into a deflationary spiral.
A weaker labor market will not just be a factor in shelter inflation. While the relationship between labor market slack and inflation is weaker than it once was, it is still significant and weaker wage growth is tied to lower inflation. The sudden stop in economic activity has led many businesses to temporary shutter their doors and cut jobs. The weakness in the labor market could potentially weigh on wage growth, which could then exert some downward pressure on CPI inflation. But wage growth can be sticky, and it responds to higher unemployment only slowly. If, as we forecast, the unemployment rate begins to recede in coming months, then any downward pressure on wage growth should remain modest.
Further, inflation expectations, which have an important bearing on actual rates of inflation, are not at present signaling that deflation is imminent. Survey measures of inflation expectations for the next 5-10 years remain near historic lows, but within the range of the past five years or so. Market-based measures of long-term inflation expectations, which are calculated using yields on longer-dated U.S. Treasury securities, have moved lower since the onset of the pandemic. But these measures, which are higher today than they were during the depths of the financial crisis a decade ago, are not signaling that deflation is right around the corner.3
Lessons from Japan and Greece
What lessons can we draw from other countries that have experienced bouts of deflation in recent years? The Japanese economy settled in for years of relative stagnation after its asset price bubbles imploded in the early 1990s. Growth in real GDP, which averaged 4.4% per annum during the heady years of the 1980s, slipped to only 1.5% on an annual average basis between 1990 and 2007. The unemployment rate jumped from 2% in early 1990 to 5.5% in 2002, the highest rate in Japan in at least 50 years. The CPI peaked in 1998 and trended lower until 2013. That said, the overall CPI in Japan declined only 5% over that 15-year period.
Greece also experienced a bout of deflation in the wake of its economic collapse that saw real GDP tumble 27% between 2007 and 2013. The unemployment rate, which receded to less than 8% before the financial crisis skyrocketed to 28% in 2013. Due to the depressed state of the economy, the consumer price index in Greece trended lower between late 2012 and early 2016. But it declined only 5% over that period.
In short, both Japan and Greece have experienced bouts of deflation in recent years. But both cases were mild—the price level fell only 5% or so—and both cases followed prolonged periods of economic weakness in the respective economy. Although the U.S. economy is in the midst of its sharpest downturn since the Great Depression, we look for recovery to begin in the third quarter of this year. Unless the U.S. economy suffers a prolonged slump à la Japan and Greece, which is not our expectation, then it is not likely to experience a bout of deflation.
Conclusion
CPI inflation has fallen markedly in recent months. Not only did the collapse in oil prices put downward pressure on the CPI, but the economic standstill caused by COVID-19 has weighed on the core rate of inflation. Although prices of individual goods and services could slide further in coming months, a period of outright deflation, or a sustained drop in the overall price level does not seem likely unless the U.S. economy were to slip into a prolonged slump, which is not our expectation. We acknowledge, however, that a significant acceleration in COVID-1 cases could lead to a second closing of the economy in coming months. In that event, the U.S. economy could edge nearer to a deflationary bout.
1 We forecast that global GDP will decline 3.8% in 2020, the deepest rate of contraction since IMF data become available in 1980.
2 See Sarah House and Shannon Seery, “Gimme Shelter or Inflation Gonna Fade Away,” (October 08, 2019), for a deep dive into shelter inflation and how the BLS calculates the shelter components of the CPI.
3 Jens H.E. Christensen, James M. Gamble IV, and Simon Zhu, “Coronavirus and the Risk of Deflation,” (May 11, 2020).


