
As of the end of April, China is set to meet just 8% of its energy product import obligations under the terms of the Phase One Trade Agreement. While China is closer to meeting its objectives for manufacturing and agricultural products, it is on track to meet just 47% of the agreed “Expansion in Trade” in the phase one deal.
So how is that phase one trade agreement going?
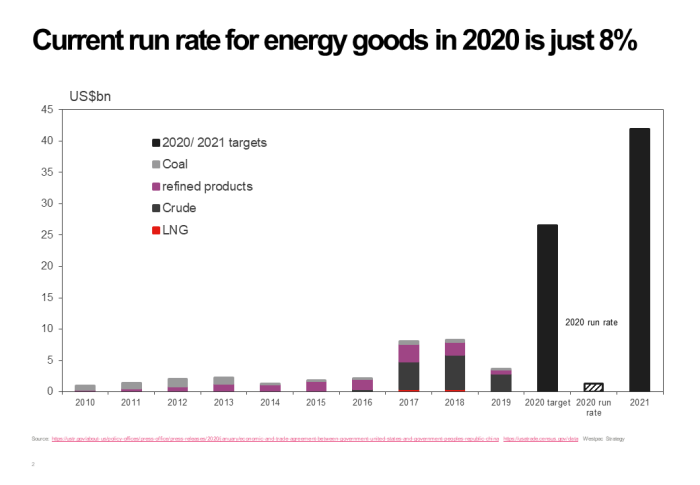
Back in February, we asked the question can “China actually buy US$50bn of US energy products?” and concluded that we were very “sceptical that China will be able to buy that much energy from the US, and that the US will be able to economically supply that much energy to China.”
Given that we now have detailed data for the first third of 2020, we are now even more sceptical about China meeting its energy purchase obligations.
As of the end of April, China is set to meet just 8% of its energy product obligations under the terms of the Phase One Trade Agreement. Indeed, to meet the agreement, it would have to step up its purchases by a factor of 17 times the average purchase in the first third of the year, and buy that amount in every month through to the end of 2020. That would appear to be extremely difficult to achieve.
While China is closer to meeting its objectives for manufacturing and agricultural products, it is on track to meet just 47% of the agreed “Expansion in Trade” in the phase one deal. On top of the 17 times increase in energy purchases, it will have to double manufacturing imports and triple the value of its 2020 agricultural purchases. 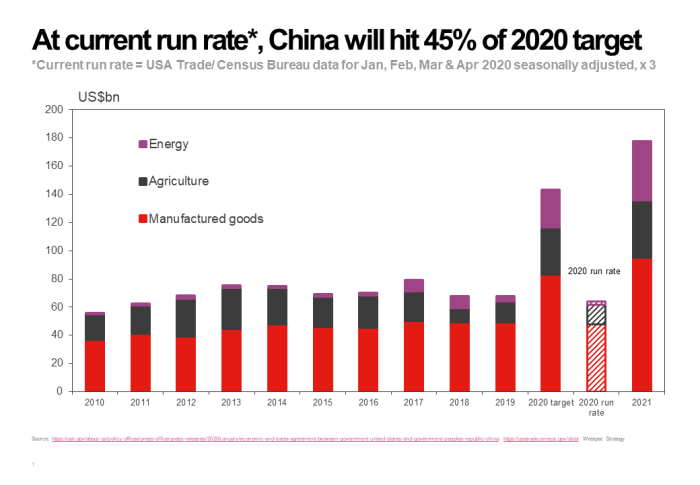
Now it is important to note that expanding trade is just one chapter within a complex agreement. The agreement includes chapters on:
- Intellectual property including sections on protecting trade secrets and confidential business information
- Technology transfer including sections on scientific and technological cooperation
- Trade in food and agricultural products including sections on accepting USDA and FDA audits and standards
- Financial services including sections on opening up banking services, credit rating services, electronic payment services, insurance, securities, fund management and futures services within agreed periods of time.
- Exchange rate practices designed to avoid “manipulating exchange rates … to gain an unfair competitive advantage”.
- Expanding trade including a “commitment that purchases and imports into China will be no less than $32.9bn above the corresponding 2017 baseline amount” for specified manufactured goods; “$12.5bn above the corresponding 2017 baseline amount” for agricultural goods and “$18.5 billion above the corresponding 2017 baseline amount” for energy products.
So, it is clear that numerical trade expansion obligations are not the only measure of whether China is meeting its agreed objectives. However, these measures are finite and can be observed and tracked, but there are also grey areas.
The agreement specifies targets above a 2017 baseline for a specified list of products. Using the baseline formula plus the very detailed list of 4 and 6 digit HS codes, we calculate those targets to be $83.3bn of manufacturing products; $33.4bn of agricultural products and $26.5bn of energy products for a total of $143.2bn. However, the agreement also includes targets on services for which monthly data is not available so we cannot include services in the above analysis. On top of this, about a third of goods exports from the US to China in 2017 are not covered by numerical targets and thus not analysed here.
Further, some of the weakness in terms of US exports of energy will have been driven by the collapse in crude prices in March and April. However, in volumes terms, US crude exports to China are currently running at just 28% of the volumes exported over the same period in 2017.
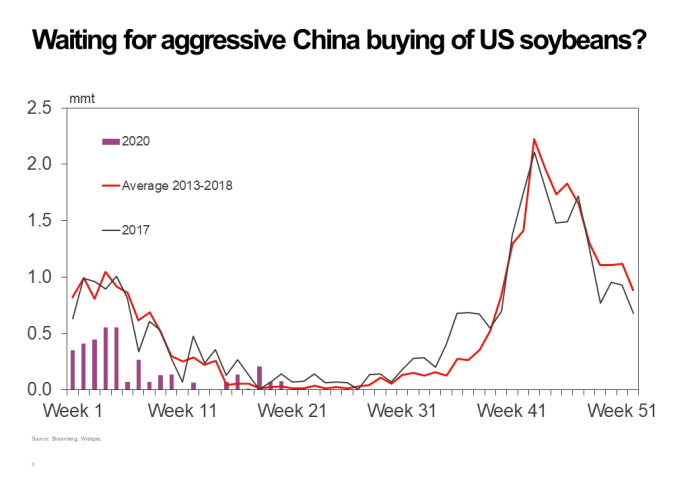
The same price story could be argued for soybeans which are the single largest agricultural product exported from the US to China given that prices dropped to near decade lows in April. However, using USDA loadings data for soybeans destined for China, with data available to the end of May, volumes so far this year are just 65% of volumes seen over the same period in 2017. So, while prices are part of the story, the fact that volumes remain well below 2017 levels means they are not the key driver.
Now the joint call between Vice Premier Liu He, U.S. Treasury Secretary Steven T. Mnuchin, and Ambassador Robert Lighthizer that took place on 7th May concluded that “both countries fully expect to meet their obligations under the agreement in a timely manner”. Subsequently, the USTR announced that US producers could export a wide range of products including blueberries, Hass avocadoes, barley and dairy powder to China so we should expect to see a broadening of agricultural exports in May data and the months ahead. 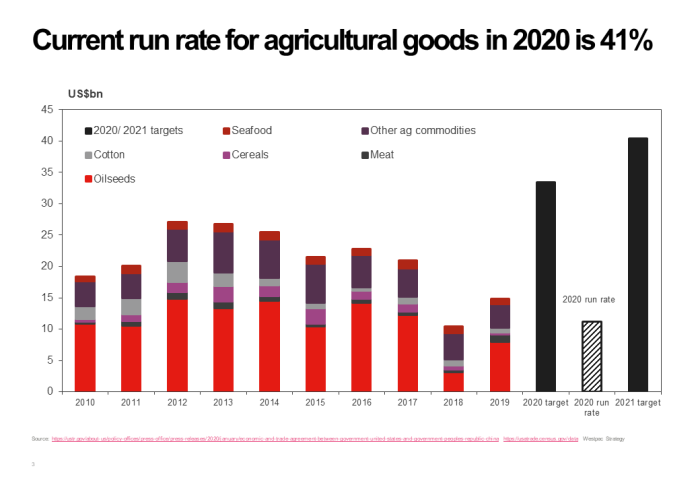
However, given that both the value and volume of imports so far in 2020 remain so far behind 2017 levels and are not showing any obvious signs of picking up, we stand by our earlier scepticism that it is unlikely that China will be able to meet its obligations under the phase one trade agreement. A period of much increased tension between the US and China likely lies ahead in our view.


