US stocks had their worst day since March as investors remained cautious after the Federal Reserve offered a dire assessment of US economic prospects. They were also concerned about a new wave of coronavirus in the United States following weeks of protests. Bank stocks were badly hit after the Fed predicted that rates would stay near zero until 2022 while travel stocks were hurt by the prospect of a second wave. Meanwhile, energy stocks declined sharply as the price of crude oil fell by more than 4%. The Dow Jones declined by more than 1,700 points while the S&P500 declined by 5.9%. A day earlier, the Stoxx 600 declined by 4% while the FTSE 100 declined by 3.8%.
The British pound declined sharply after David Frost, the chief UK negotiator, reiterated that the country will not seek a transition period extension. This means that chances of a no-deal Brexit are high as time runs out. Traders will, therefore, be watching for an upcoming virtual meeting between Boris Johnson and Ursula von der Leyen on Monday. In the morning session, we will receive trade, manufacturing, industrial production, and GDP data from the UK. Since these numbers are for the month of April, they will send a sign about the UK performance during the lockdown.
Later we will receive inflation data from France, retail sales numbers from Turkey, and industrial production numbers from the eurozone. Additionally, we will receive the export and import price index and consumer sentiment numbers from the United States. Finally, Baker Hughes will release the oil rig count data. Last week, its numbers showed that there were just 206 active rigs in the US, down from more than 600 in January. With oil prices rising, we will want to see whether some producers are restarting their rigs.
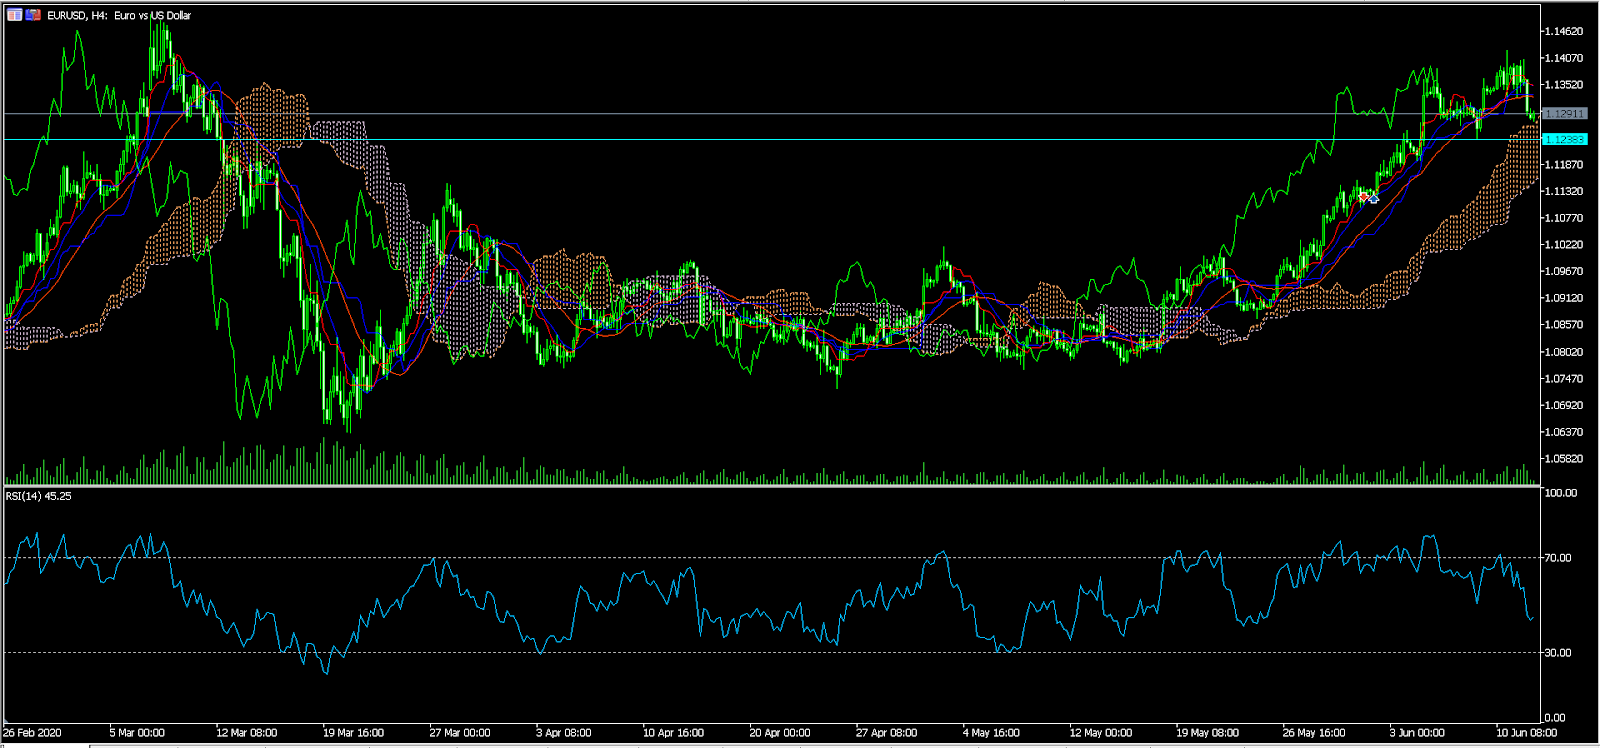
EUR/USD
The EUR/USD pair declined to an intraday low of 1.1274. On the four-hour chart, the price has moved below the 14-day and 28-day exponential moving average while the RSI has been on a downward trend. The price also seems to be entering the Ichimoku cloud, which would be a bearish sign. Therefore, if it does enter the Ichimoku cloud, the pair may continue falling as bears attempt to move below 1.1200.
GBP/USD
The GBP/USD pair declined to an intraday low of 1.2548, which is the lowest level it has been since Friday last week. On the four-hour chart, the price is nearing the 61.8% Fibonacci retracement level. It has also moved below the 100-day exponential moving average. This means that the pair may continue falling as bears attempt to test the 61.8% Fibonacci level at 1.2522 or even below 1.2500.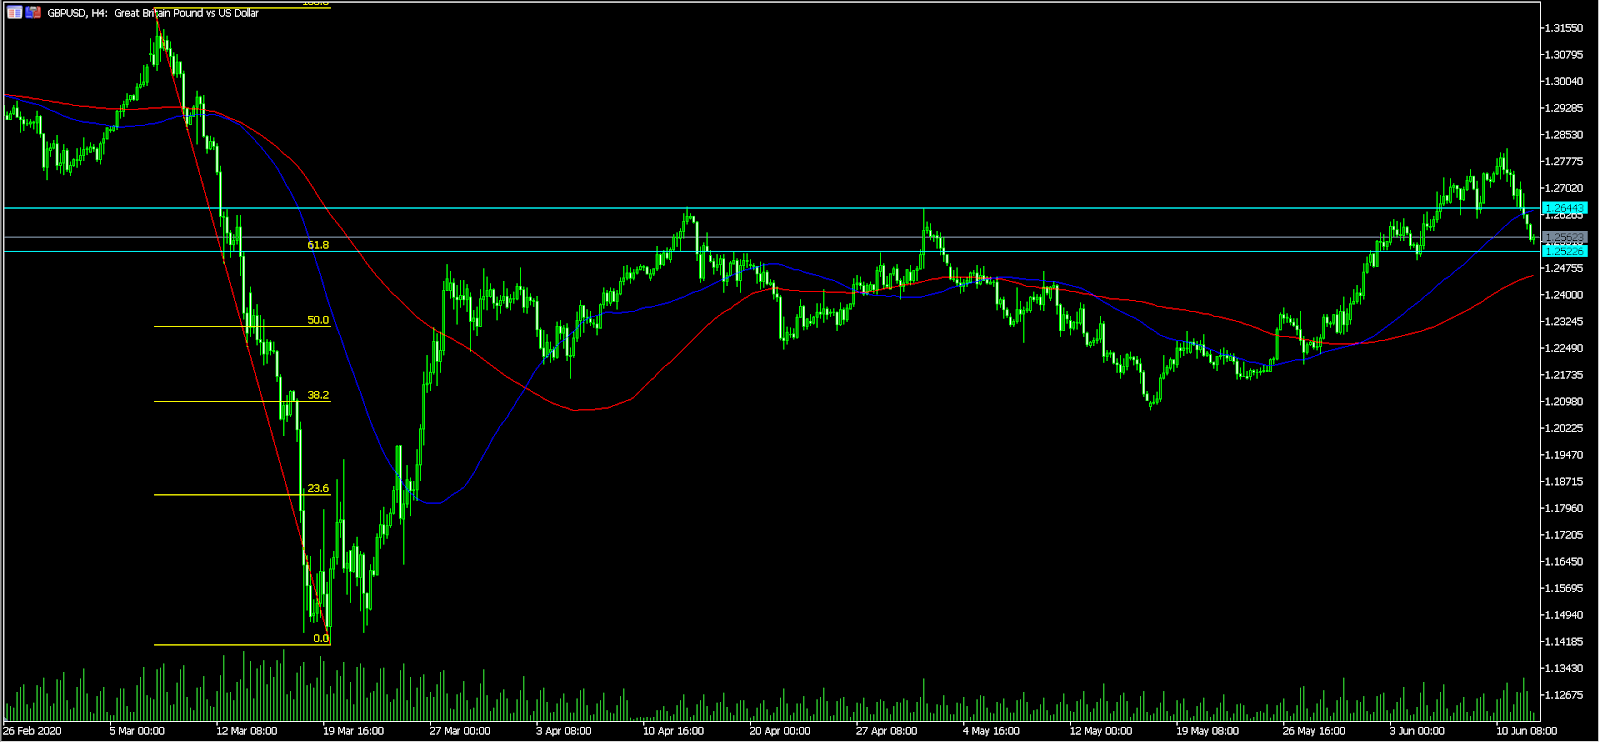
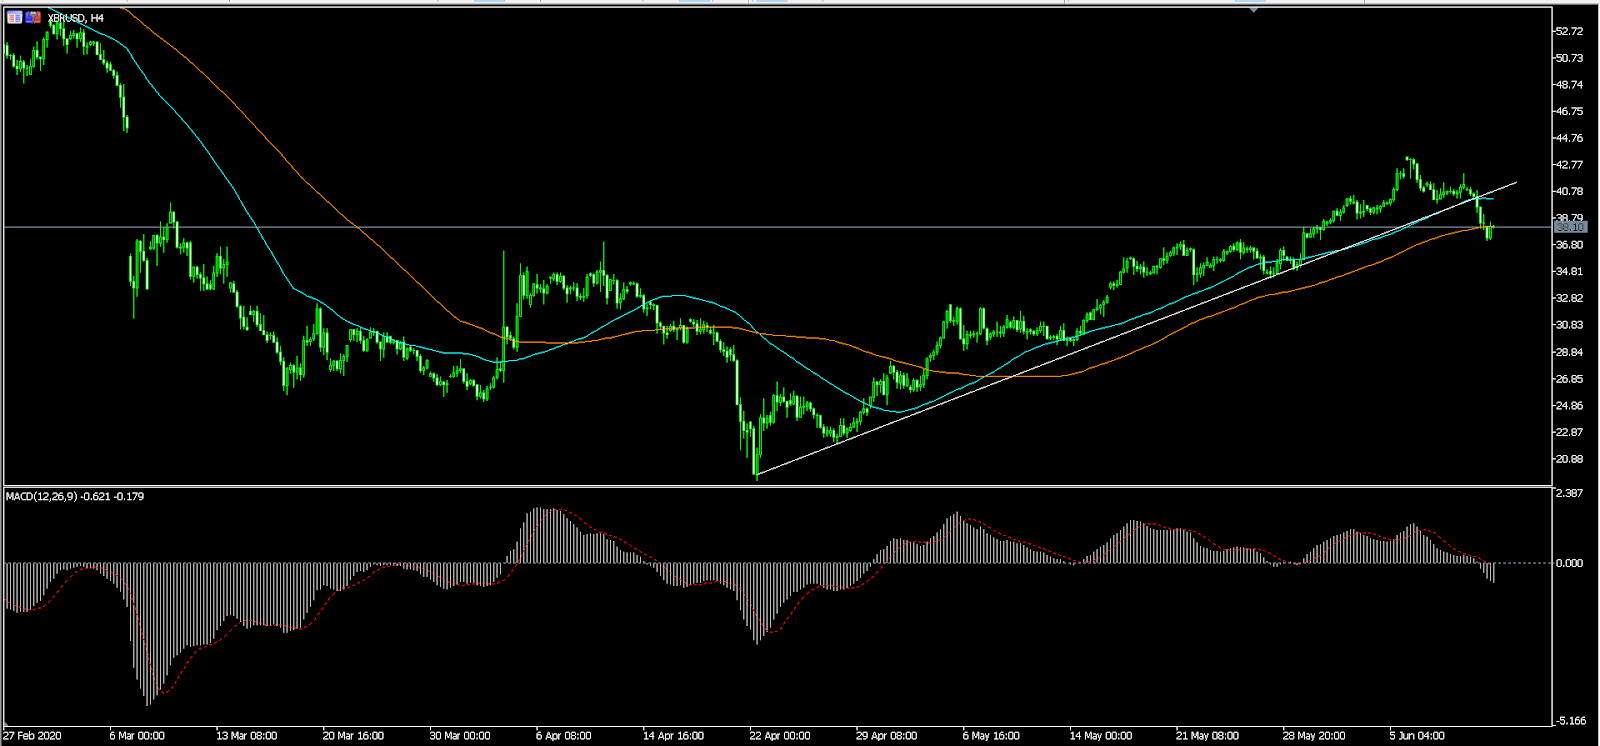
XBR/USD
The XBR/USD pair declined as traders continued to worry about the risks of a second wave of the virus. The pair fell to an intraday low of 37.19. On the four-hour chart, as the price dropped, it moved below the important white trendline and below the 50-day and 100-day exponential moving averages. Also, the signal and histogram of the MACD have moved below the neutral line. This implies that the pair may continue falling as bears target 35.0.