
U.S. Highlights
- Financial markets tumbled this week as worsening coronavirus caseloads fueled concerns about the global economic outlook. The S&P 500 is on track to end the week 6% below last week’s close.
- The American economy rebounded sharply in the third quarter. Powered by consumer spending, real GDP increased at a 33.1% annualized rate, recovering two-thirds of the activity lost in the first half of the year.
- Boosted by supplemental payments for lost wages, personal income rebounded by 0.9% in September. Personal spending accelerated by 1.4%, while the personal saving rate remained elevated at 14.3%.
Canadian Highlights
- Financial market sentiment was negative this week. Uncertainty around U.S. fiscal policy remains at the forefront. At the same time, rising virus caseloads and renewed restrictions ignited concerns on the trajectory of growth in parts of Europe.
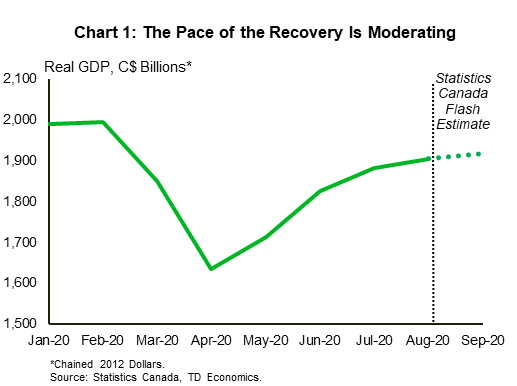
- Canada’s real GDP growth in August came in slightly better than expected (+1.2%). Given the backward-looking nature of the release, attention is turning to more high frequency indicators to gauge the impact of renewed (albeit more targeted) restrictions in the past month.
- The Bank of Canada reaffirmed its continued accommodative monetary policy stance. It made its forward guidance more explicit, while announcing technical tweaks to its asset purchase program.
U.S. – Economic Growth Resumes in Q3
Risk-off sentiment prevailed this week as worsening coronavirus counts fueled concerns about the global economic outlook. Disappointing earning reports later added to these concerns and, as of writing, the S&P 500 is on track to end the week 6% lower.
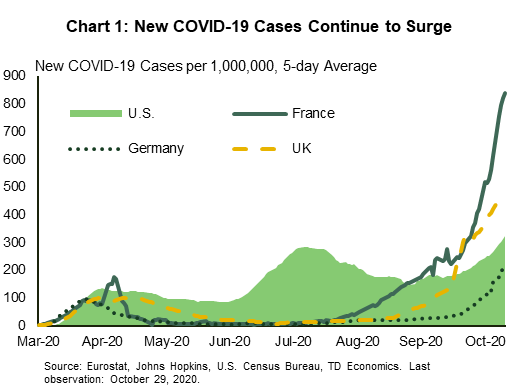
New COVID-19 cases are continuing to surge around the globe (Chart 1). Fresh daily records have prompted authorities in France and Germany to impose new lockdowns, which will notably include a month-long shutdown of bars and restaurants. Likewise, new infections are rising to new heights stateside. The overall U.S. case count crossed the 9 million mark this week, while hospitalizations are reaching levels that were last seen in August.
On the economic front, this week saw the release of real GDP data for the third quarter. As widely expected, the American economy rebounded sharply in Q3 following one of the steepest contractions on record in Q2. Economic growth accelerated at a 33.1% annualized pace (Chart 2), recovering about two-thirds of the activity lost in the first half of the year. Overall, real GDP is still 3.5% below where it was at the end of 2019. The rebound was largely powered by consumer spending (+40.7%), which was itself spearheaded by an impressive jump in durable goods spending (+82.2%). Services spending rose more modestly (+38.4%).
The remarkable recovery in the U.S. housing market was also front and center in the GDP report. Residential investment grew by 59.3% on account of expectation-defying strength in the resale market, and is now 5.1% above its pre-pandemic level. Other major GDP components also saw considerable increases with the exception of government spending, which fell by 4.5%. State and local governments, whose revenues have plummeted during the pandemic, reduced their expenditures (-3.2%) for the second straight quarter. Employment within these entities has contracted by 6% since February.
The spending recovery was also borne out in the September personal income and outlays report. Personal spending grew by 1.4% m/m, the fifth consecutive month of gains, while personal income rebounded by 0.9% following a pullback in the month prior. An increase in lost wages supplemental payments, which reflected the executive order to replace the expired Pandemic Unemployment Compensation program, provided a fillip.
All things considered, the extraordinary pace of growth in the third quarter is unlikely to be sustained. Indeed, the splurge in durable goods spending over the summer is unlikely to be repeated, while the resurgence in new cases is placing the upswing in services spending in jeopardy. The looming expiration of eviction moratoriums across the country constitutes an additional downside risk to the near-term outlook.
With the election only a few days away, the focus will soon move back to the next installment of fiscal support. At a time when the pandemic continues to upend the livelihoods of millions, the importance of additional government support is hard to understate. Here’s hoping that Washington is able to deliver on this front, sooner rather than later.

Canada – Economic Recovery Turning Choppy
On balance, risk-off sentiment prevailed this week. Uncertainty around U.S. fiscal spending was joined by concerns on rising virus caseloads and renewed restrictions in parts of Europe. The S&P/TSX Composite followed its global peers lower, dropping 5% on the week (as of writing). Unsurprisingly, WTI oil prices also tumbled (-10.8%).
Domestically, this week was also packed full of data releases and policy announcements. Today’s backward-looking industry-level GDP was the highlight. Growth continued to rebound at a faster-than expected rate of 1.2% in August (consensus: 0.9%), leaving the level of real GDP 4.6% below its pre-pandemic (February) level. Momentum is predictably slowing, with Statistics Canada’s flash estimate pointing to a 0.7% increase in September (Chart 1). Still, the release leaves us with a better-than-expected starting point to the fourth quarter.
The uneven recovery narrative was further reinforced in the GDP release. “High-touch” services industries (accommodation & food services and arts and entertainment) saw the strongest outturns, but remain the most detached from their pre-pandemic levels. In addition, other industries are still in the doldrums. For instance, activity in the oil & gas extraction sector dipped further in August. Meanwhile, output was above its pre-pandemic levels in six industries.
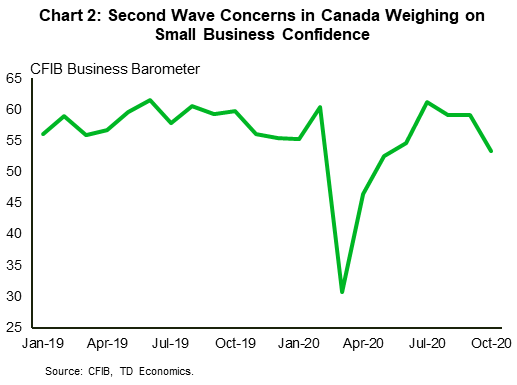
We’ve noted before that the recovery is likely to turn bumpy as it enters the “recuperation” stage. October seems to be the first bump on the road to recovery. Earlier this month, Canada’s largest provinces enacted new (targeted) restrictions on economic activity as daily virus cases accelerated. Higher frequency data are now beginning to reflect this reality by reversing earlier gains. The CFIB small business confidence barometer (Chart 2) dipped to its lowest level since May. In a separate release, the Bloomberg Nanos consumer confidence index also edged down for the fourth consecutive week. Elsewhere, mobility and restaurant booking data are pointing to a pullback in consumer engagement this month.
Against this backdrop, the Bank of Canada reiterated its intention keep monetary policy accommodative in its interest rate announcement this week. Indeed, the Bank’s forward guidance was made more explicit, with 2023 cited as the earliest at which the policy rate would rise from its effective lower bound (0.25%). Governor Macklem also emphasized the that the current asset purchase program would remain well into the recovery (albeit with some possible tweaks). The key change to the Bank’s decision this week was more technical in nature. The central bank will focus its future purchases on the longer-dated portion of the curve. The intention behind this is to influence maturities that have more impact on benchmark borrowing rates. The likelihood of negative rates was once again, downplayed, citing the potential distortionary impacts on the financial system.
Although monetary policy is expected to stay the course for the foreseeable future, the same cannot be said on fiscal policy. In her first speech as Finance Minister this week, Minister Freeland hinted at a shift in focus from bridge support payments to new programs and longer-term spending initiatives to aid the recovery. Responding to concerns on Canada’s rising debt burden, the Minister emphasized the she disagrees with the tenets of Modern Monetary Theory – highlighting that the government’s spending increases plan are temporary and meant to dig the economy out of its current hole.
U.S: Upcoming Key Economic Releases
U.S. ISM Manufacturing Index – October
Release Date: November 2nd, 2020
Previous: 55.4
TD Forecast: 57.0
Consensus: 55.8
A renewed uptrend in COVID cases and the fading of fiscal stimulus point to weakening in growth, but there has generally been no sign of weakening in the regional manufacturing surveys for October. We expect that pattern to extend to the ISM survey as well. The services sector is likely to be affected more than the manufacturing sector by the rise in COVID cases, at least initially.

U.S. FOMC Meeting – November
Release Date: November 5, 2020
Previous: Funds rate 0.0-0.25%
TD Forecast: 0.0-0.25%
Consensus: 0.0-0.25%
Fed officials have been emphasizing that the economy is still far from recovered, and risks are tilted to the downside, but the official data have continued to surprise on the upside side thus far. Against that backdrop, we don’t expect any new policy announcements to come out of the upcoming FOMC meeting, and changes to the wording of the statement are likely to be minimal, but potential changes to the QE program and associated guidance will likely be discussed. We expect the Fed to make the QE program more accommodative by increasing the average maturity of purchases, but not yet.

U.S. Employment– October
Release Date: November 6, 2020
Previous: NFP 661k; UE rate 7.9%; AHE 0.1% m/m, 4.7% y/y
TD Forecast: NFP 300k; UE rate 7.8%
Consensus: NFP 600k, UE rate 7.6%;
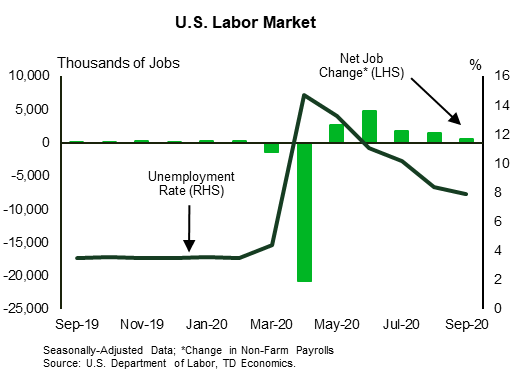
Payrolls probably rose fairly strongly by pre-COVID standards, but with the pace slowing again, and the level still down around 10mn since February. (The 661k rise in September followed 1.5mn in August, 1.8mn in July and 4.8mn in June). Our +300k forecast assumes a 200k decline in government payrolls, due to an unwinding of census hiring as well as another drop in state and local employment. We expect the downtrend in the unemployment rate to at least slow. Average hourly earnings likely continued to show a net pickup due to mix shifts—with more net weakening in low-wage than high-wage jobs boosting the average level. The 12-month change in hourly earnings was around 3% through February.
Canada: Upcoming Key Economic Releases
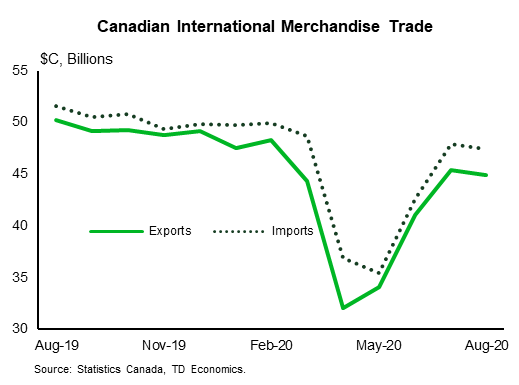
Canadian International Trade – September
Release Date: November 4, 2020
Previous: -$2.45bn
TD Forecast: -$2.3bn
Consensus: NA
The international merchandise trade deficit is forecast to edge lower to $2.3bn in September, reflecting offsetting increases to both exports and import activity. Exports will be bolstered by motor vehicles; even though (nsa) auto production was largely unchanged in September, favourable seasonal factors and a surge in US imports suggest a solid contribution from motor vehicle exports. Manufacturing PMIs and small business sentiment also support increased export activity, although energy exports will be weighed down by both lower crude prices and weaker PADDII imports. Real exports should print slightly below the nominal increase, owing to higher factory prices in September.
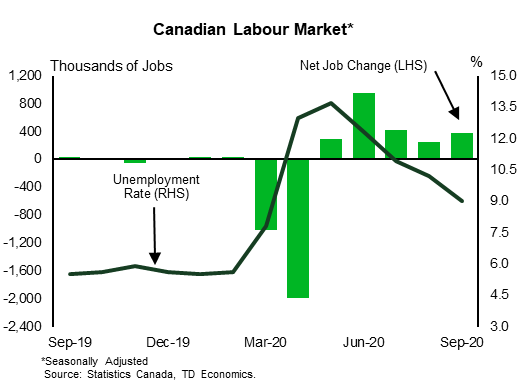
Canadian Employment – October
Release Date: November 6, 2020
Previous: 378k, unemployment rate: 9.0%
TD Forecast: 25k, unemployment rate: 8.9%
Consensus: NA
TD looks for the labour market recovery to slow to a near-halt with just 25k jobs created in October, down from 378k the prior month, with material risk of a negative print. Although we expect most industries to continue rehiring workers, the public health backdrop has changed quickly from September and we expect a heavy toll on those industries affected by new covid measures. Food services have contributed nearly 250k jobs to the labour market recovery in Ontario & Quebec from May-Aug, and new (regional) restrictions on indoor dining will place many of those positions at risk. These measures were put in place before the reference week and preceded a sharp drop in OpenTable reservations, while other measures should have a smaller impact on recreational services. A modest increase in total employment should leave the unemployment rate at 8.9%, 3.3pp above pre-covid levels.


