Gold’s price moved significantly lower on Monday even though some of the ground was regained later on in the US session. The precious metal initially moved higher in the early Asian session until the European morning where it dropped to levels last seen in the previous week. Investors could have been overwhelmed by media headlines regarding the worsening circumstances from the virus outbreak especially in the UK. Gold traders may had fled to the USD which also saw a short-lived jump higher against many of its major counterparts. The greenback’s strength was also evident on the USD index on Monday’s session. The risk off mood as a result of the worsening circumstances globally could continue to affect investors decision making in the short term. At the same time safe haven outflows for Gold may be supported by the US Congress reaching a deal for a fiscal stimulus package.
At the moment, Gold is trading between our (R1) 1910 resistance level and our (S1) 1855 support level. Yesterday XAU/USD moved lower and tested our (S1) 1855 support level but was unable to breach it. If the bearish momentum continues then the (S2) 1820 support line and the (S3) 1775 support hurdle are in our opinion the next possible stops. Due to the fact the Gold has displayed its gift of making large abrupt movements in the past days we have set our levels rather widespread. In the opposite direction, if the bulls take control then the yellow metal could initially surge to test our (R1) 1910 resistance level. Other levels we have noted to the upside are the (R2) 1955 line and the (R3) 1995 hurdle. The RSI indicator below our chart is currently leaning towards the 30 level possibly displaying some bearish tendencies for the time being.
US stock markets end up mixed while WTI moves lower
The risk off sentiment was also evident in other instrument sectors like the major US stock markets and commodities like WTI. WTI prices fell from a nine month high on Monday possibly displaying traders worries and negative sentiment over the commodity’s future demand. Even though WTI initially lost approximately $3 USD in value, it rebounded higher later on in Monday’s US session and managed to regain most of the ground lost. Oil demand could be on retreat as strong lockdowns measures in Europe may stay with us as we move into the next year. The Nasdaq moved lower along with the S&P 500 both closing in red, yet the Dow was marginally higher on gains from the financial sector. US banks may have been supported by comments made by the US Federal Reserve on Friday stating they have the necessary capital to endure more losses. The banks will also be permitted to pay out dividend and buy back stock on a limited basis soon. One of the biggest losers for the S&P500 was Tesla Inc. that lost -6.50% on its debut trading day on the index. Even though this was not the brightest start for Tesla under the S&P500, investors have seen the electric car makers share price surge higher than +650% in 2020, making it a very attractive choice for many portfolio managers. Interestingly, according to Goldman Sachs Tesla’s inclusion to the major index could impact the Volatility Index the options-based gauge of market turbulence.
WTI initially broke below the (S1) 47.50 support level with the selloff yesterday but in the US session rebounded and took back most of the ground lost. After the selloff the commodity traded and stabilized nearby our (S1) confirming that traders currently recognize it as an important barrier. Other support levels we have noted lower are the (S2) 45.50 and the (S3) 43.50. To the upside we have noted the (R1) 49.50 barrier which was briefly attempted on the 18th of December and is the highest level reached in 9 months for the commodity. Even higher we have also noted the (R2) 51.50 and the (R3) 53.50 as possible targets for the bulls. Overall even with the latest selloff, WTI has not breached its upward trend line formed in the past months so in our opinion the bulls may still be in control.
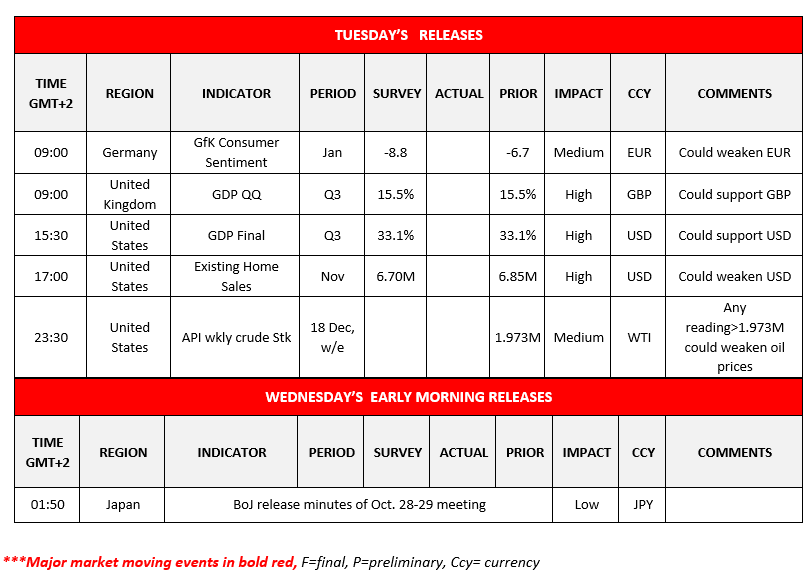
Other economic highlights today and early Wednesday
In the European morning today we get the German GfK Consumer Sentiment for January and a little bit later we get the UK GDP for Q3.In the US session we get the US GDP Final for Q3, the US Consumer Confidence for December and the US Existing Home Sales for November. Later in the American session we get the weekly API crude stock figure. On Wednesday’s Asia session we get BOJ’s minutes related to its October meeting.
XAU/USD Daily Chart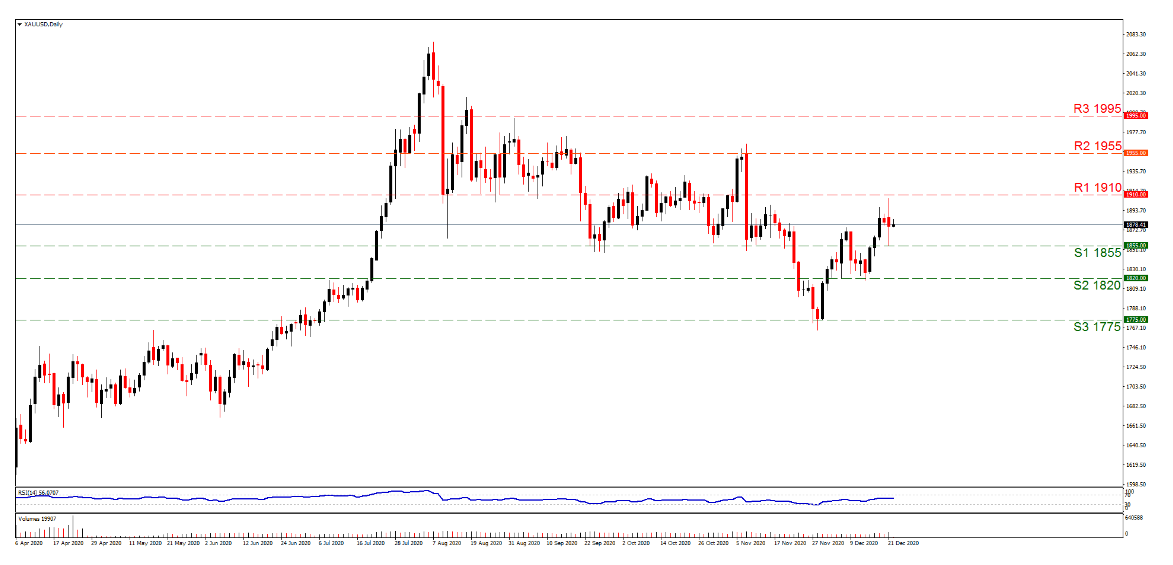
Support:1855 (S1), 1820 (S2), 1775 (S3)
Resistance:1910 (R1), 1955 (R2), 1995 (R3)
WTI H4 Chart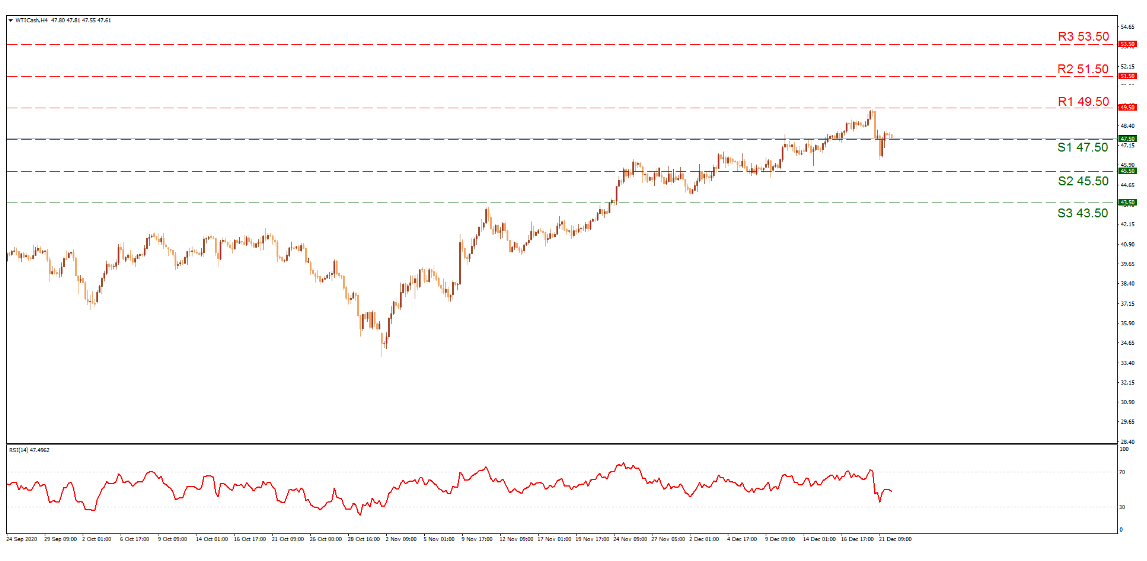
Support: 47.50 (S1), 45.50 (S2), 43.50 (S3)
Resistance: 49.50 (R1), 51.50 (R2), 53.50 (R3)