
The euro is unchanged in the Thursday session. Currently, EUR/USD is trading at 1.2123, up 0.04% on the day.
Euro
The euro fell below the symbolic 1.20 line last week, for the first time in 2020. The US dollar appeared to have some momentum and a drive towards the 1.19 line appeared likely. However, last week ended with an anemic US nonfarm payrolls report, which was just what the doctor ordered for the euro. The US dollar index has retreated after making a move towards the 91 level, and the euro has moved back into 1.21 territory.
In Asia, China and Japan are closed for the Lunar New Year, resulting in a lack of movement in the equity and currency markets on Thursday. The only tier-1 event on the schedule is US unemployment claims, and unless the forecast is wildly off the mark, we can expect EUR/USD to continue to have a quiet day. The street consensus for unemployment claims stands at 755 thousand, which would be the lowest level since early December. Unemployment claims have been dropped for three straight weeks, pointing to some improvement in the US labour market.
The eurozone economy remains weak, as the bloc continues to battle with a resurgence in Covid-19, while at the same time the vaccine rollout campaign in the bloc has been beset by logistical difficulties. One surprising bright spot has been inflation numbers out of eurozone and Germany, the bloc’s largest economy. Last week, eurozone inflation for January was stronger than expected. Headline inflation jumped 0.9%, ending a nasty streak of five consecutive declines. The core reading jumped from 0.2% to 1.4%. In Germany, Final CPI posted a strong gain of 0.8%, confirming the initial estimate. This was the highest gain since May 2019. There was more good news on Thursday, as Germany’s Wholesale Price Index (WPI) climbed an impressive 2.1% in January, up from 0.6% and crushing the forecast of 0.4%.
EUR/USD Technical
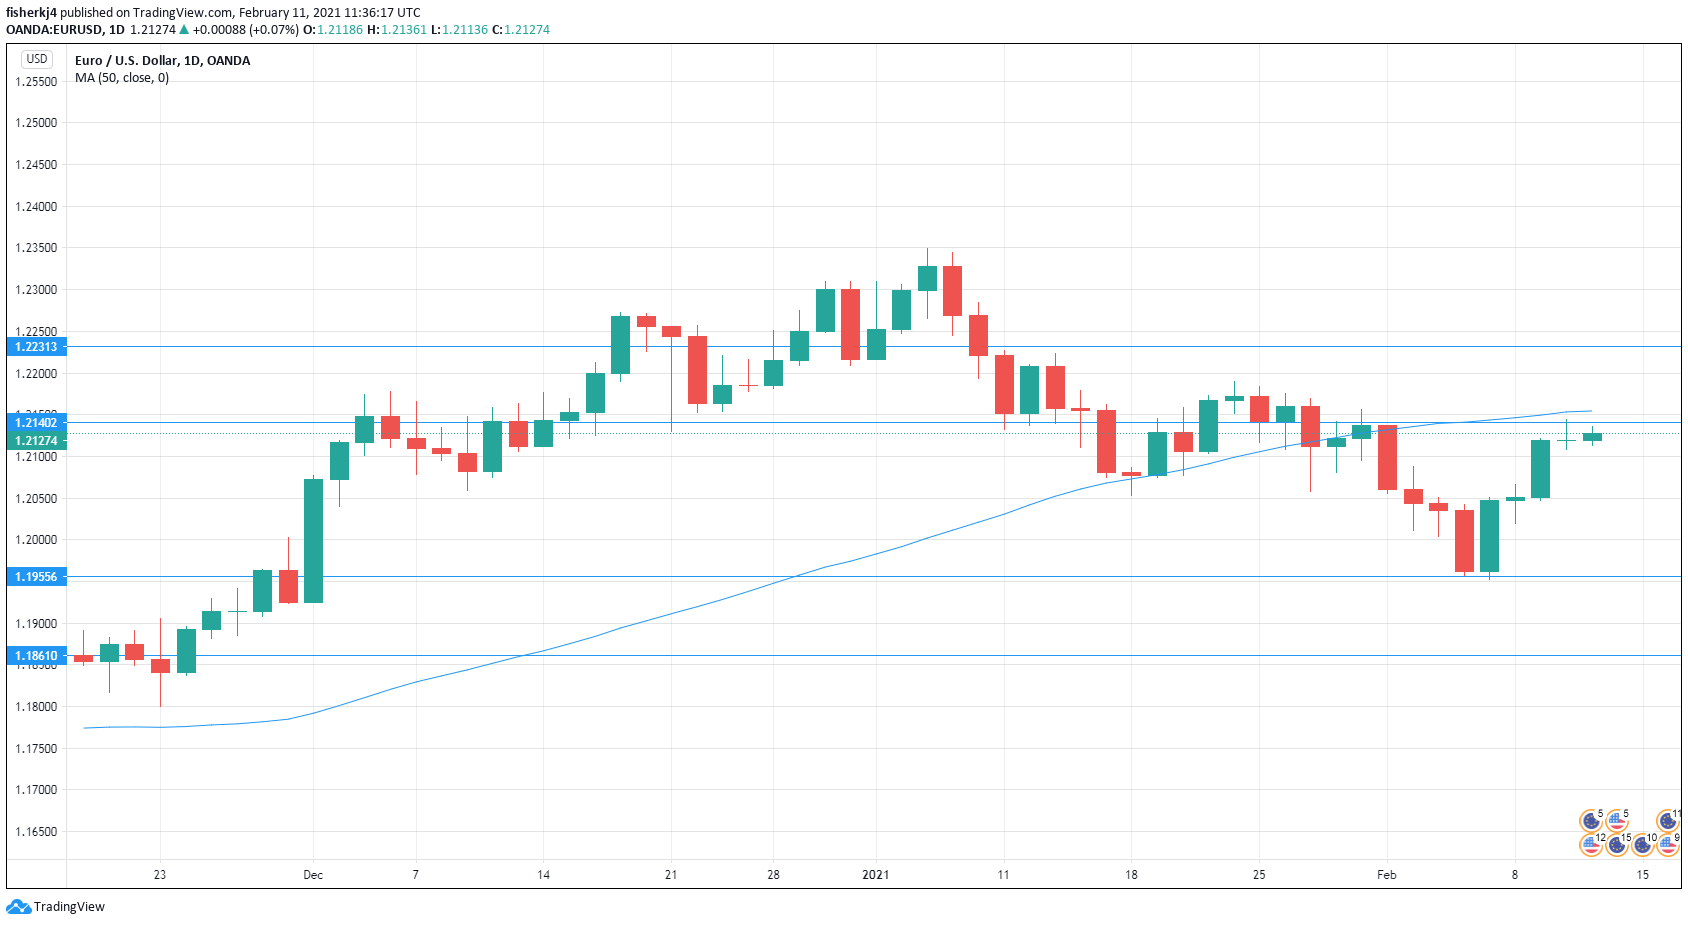
- EUR/USD continues to put pressure on resistance at 1.2140. Above, there is resistance at 1.2231. Close by is the 50-day moving average (MA) at 1.2255. A close above this line is a technical bullish signal
- There is support at 1.1955, followed by a support line at 1.1861


