WTI’s price saw a significant move higher during Wednesday’s US session, possibly performing its strongest daily upward movement in April so far. At some point WTI’s price reached $63.50 per barrel, the highest price reached in the current month. WTI’s price jumped reacting to the release of the weekly EIA crude oil stocks figure, as the bullish trend was ignited upon release of the data. US weekly crude oil inventories indicated a drawdown double than the figure forecasted (-5890K vs -2700K), grabbing traders attention immediately. Refinery utilization rates rose by 1 percentage point to 85% of overall capacity which is a one year high, a figure last seen the month just before the pandemic broke out. (March 2020)
In the monthly report of the International Energy Agency (IEA), a French watchdog of the industry it was noted that the fundamentals of the Oil market seem to be more optimistic at the moment as the vaccination process is carried out extensively and is forecasted to speed up further in the following months. In our view, the vaccination process could send Oil demand much higher and sooner than expected. It was noted however that some uncertainty is also present with cases rising in some countries of the world.
With its strong movement upwards on Wednesday WTI tested the (R1) 63.50 resistance level but was unable to breach it. Yet if the upward momentum continues and the (R1) is breached then the (R2) 62.00 barrier could become a target as was the case on the 17th of March when the level was last tested. Even higher than that we have set the (R3) 66.50 hurdle that was also seen previously in March and could become a target if the buying interest is strong enough. On the contrary, if the commodity’s price action is to return lower then we could see a retesting of the (S1) 61.75 support level. Lower than that the (S2) 60.00 support line is also looming. Even lower the (S3) 57.50 support hurdle represents the lowest price reached for WTI in both March and April. The RSI indicator below our chart is currently above the 70 level possibly confirming the bulls’ presence is still play.
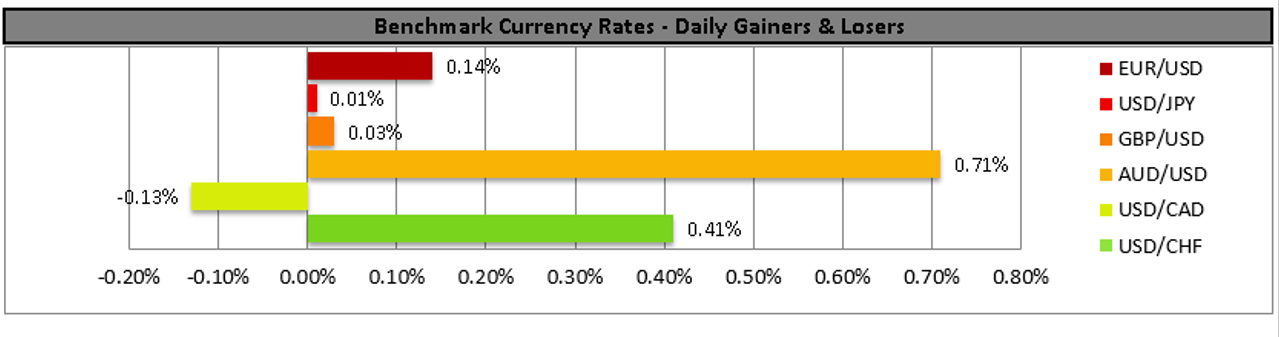
AUD/USD moves higher and intensifies break out
Today in the Asian session the employment data from Australia indicated better figures than expected. The employment figure rose to 70.7K which was double than the figure expected and the unemployment rate dropped to 5.6% from previous 5.8%. Despite the news AUD/USD seemed to stabilize and even give away some ground in today’s Asia session. AUD traders should keep in mind the heavy Chinese economic calendar to be released during Fridays’ Asian session and could move the Aussie drastically.
AUD/USD moved higher on Wednesday breaking out of the narrow trading range it was in since late March. We must note that the currency pair attempted to test the (R1) 0.7750 resistance level but was unable to do so. If the upward trend line is to continue then the (R2) 0.7775 barrier and the (R3) 0.7795 hurdle which we have set as higher levels could be also tested. Yet if the bears are to take over and the currency pair is to correct lower then the (S1) 0.7700 support level could be the first attempt for traders. If the (S1) is conquered then the (S2) 0.7680 support level could be next for the sellers. At the bottom of our chart the (S3) 0.7660 may also be reached in an extensive selling scenario however. The RSI indicator below our chart managed to reach the 70 level but may have lost strength with its recent turn downwards.
Other economic highlights today and early Tuesday:
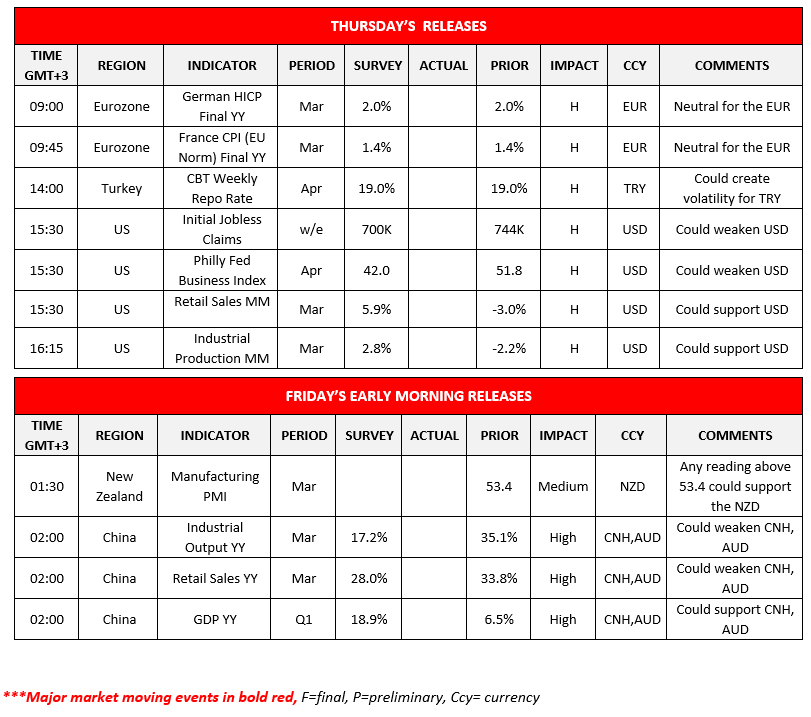
Today during the European session, we get the inflation data from Germany and France for March. Later we get the Turkish CBT weekly repo rate. In the US session we get the weekly Initial Jobless Claims figure, the Philly Fed Business Index for April and the Retail Sales figure for March along with the Industrial Production figure for March. On Friday Asian session, we get the New Zealand Manufacturing PMI for March. Also in the Asian session the Chinese Industrial Output for March, Retail Sales for March and the GDP rates for Q1 will be released.
WTI H4 chart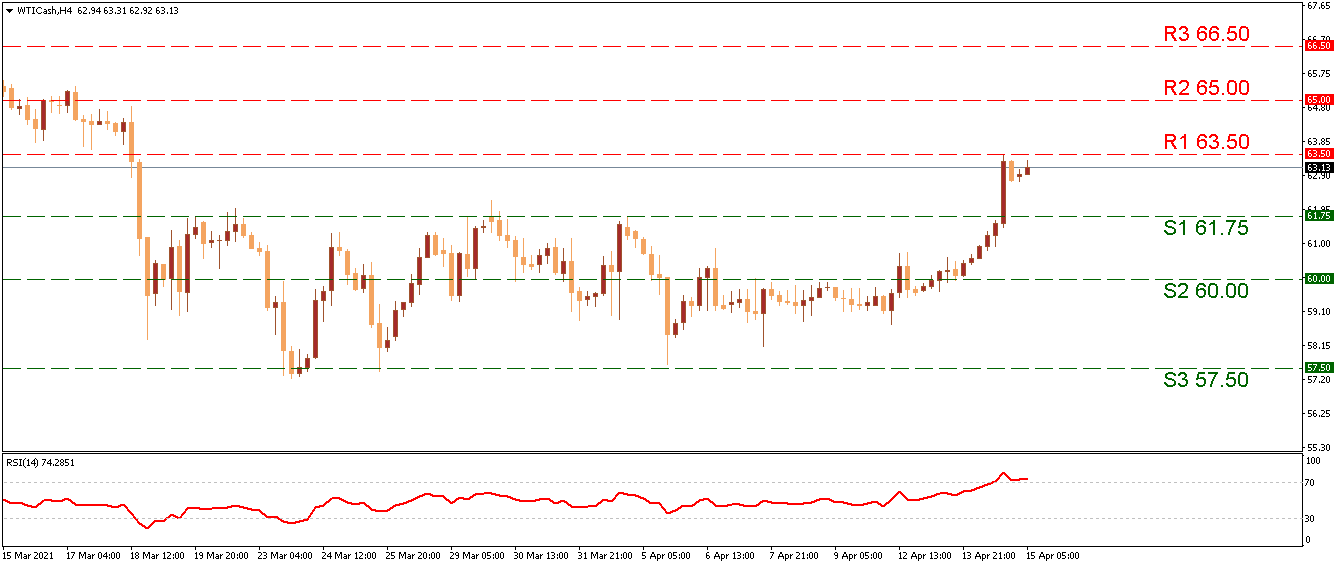
Support: 61.75 (S1), 60.00 (S2), 57.50 (S3)
Resistance: 63.50 (R1), 65.00 (R2), 66.50 (R3)
AUD/USD H4 Chart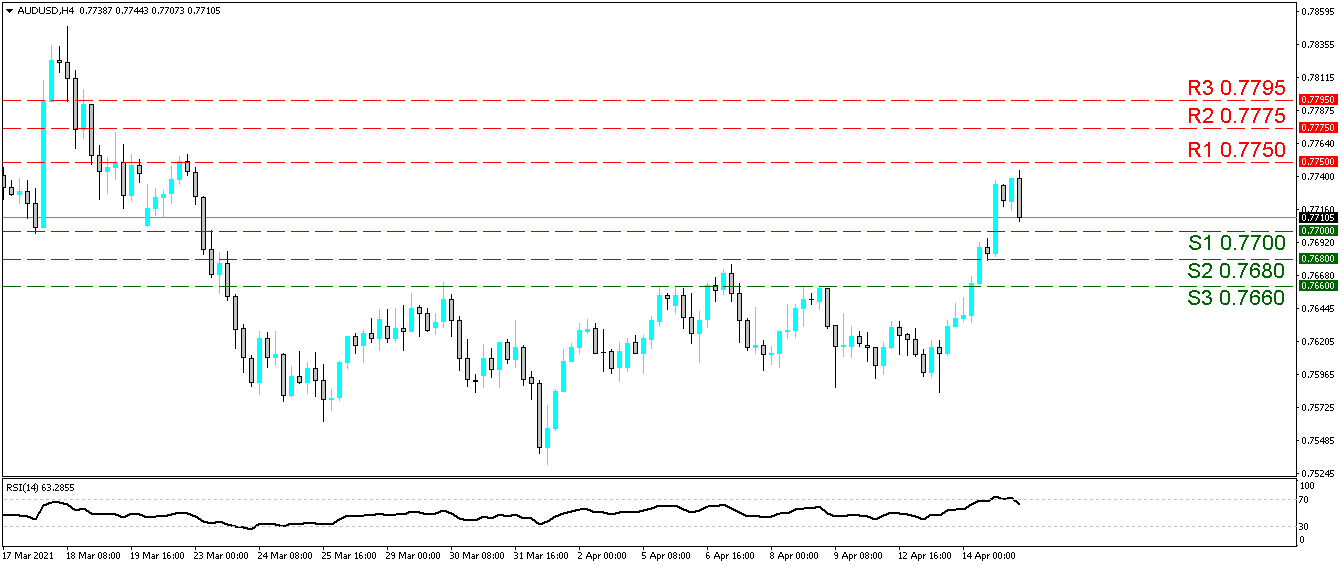
Support: 0.7700 (S1), 0.7680 (S2), 0.7660 (S3)
Resistance: 0.7750 (R1), 0.7775 (R2), 0.7795 (R3)