
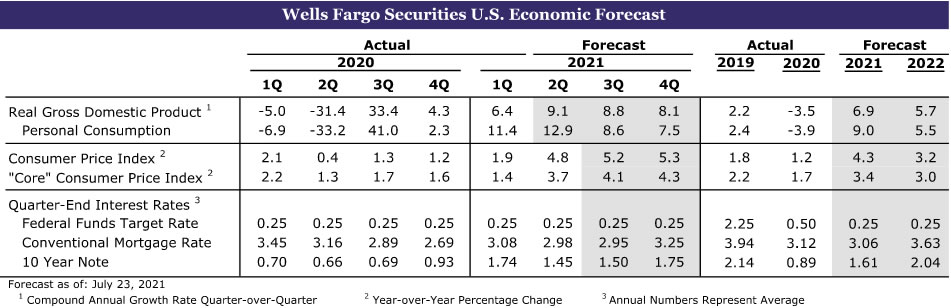
United States: COVID Rise Jitters Financial Markets, while Housing Perks Up
- July’s NAHB Housing Market Index slipped one point to 80. Housing starts beat expectations and rose 6.3% during June, although building permits fell 5.1%. Existing home sales climbed 1.4%. The Leading Economic Index (LEI) advanced 0.7% in June. Initial jobless claims rose to 419K for the week ended July 17.
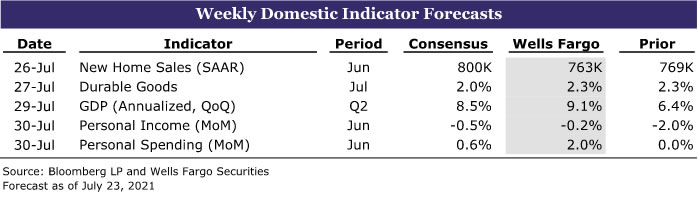
- Next week: Durable Goods Orders (Tuesday), Q2 Real GDP (Thursday), Personal Income & Spending (Friday)
International: ECB’s Easing Measures Going Nowhere Fast
- The European Central Bank made it clear at its monetary policy meeting this week that its main policy rates are unlikely to increase for the next few years amid a shift in its thinking about its inflation target. Eurozone PMI data for July were generally encouraging, but rising COVID cases present a downside risk.
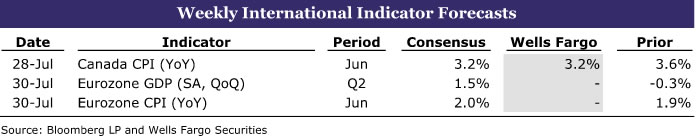
- Next week: Canada CPI (Wednesday), Eurozone GDP (Friday)
Interest Rate Watch: Faster Growth and Inflation, Tapering Ahead, but Lower Rates?
- When the 10-year Treasury yield peaked in late March, markets were pricing a fed funds rate of roughly 2.25% for that one-year period five years out, not too far from the FOMC’s “long-run” dot of 2.50%. Fast-forward to today and market pricing has tumbled to less than 1.50% for roughly the same period.
Credit Market Insights: Will Canada’s Housing Market Sustain Its Frothiness?
- Around the world, house prices have been soaring, and Canada’s housing market has emerged as one of the frothiest. While the Canadian economy is on track for a strong year in 2021, the lack of affordability and easing lending standards have raised some concerns.
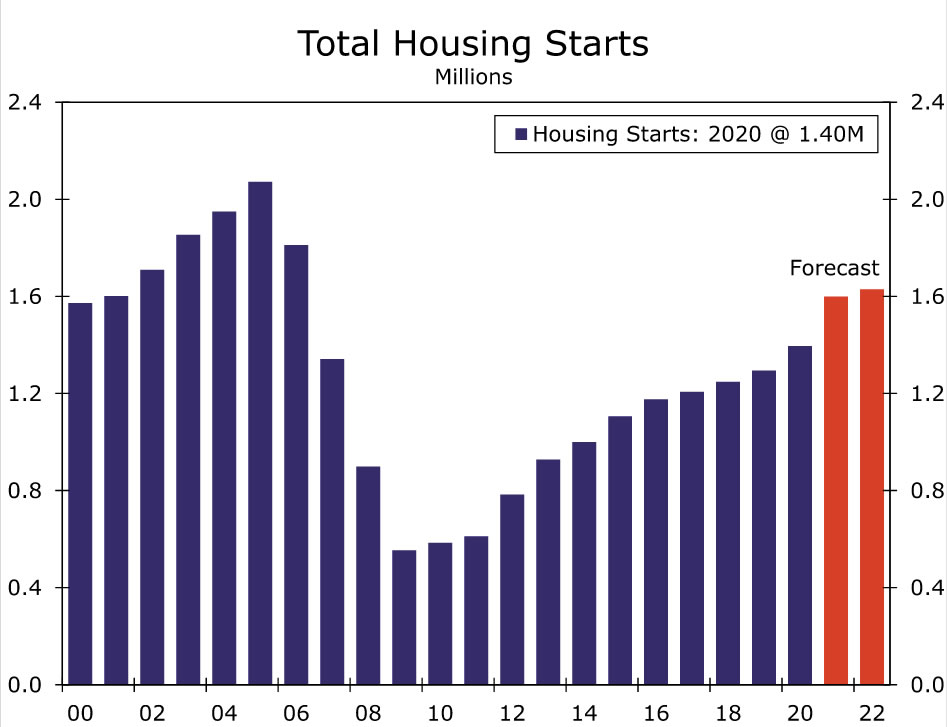
Topic of the Week: Housing Is Moving Back into Balance
- While declining affordability and supply shortages have pressured housing activity in recent months, we believe the housing market is now beginning to come back into balance.
U.S. Review
COVID Rise Jitters Financial Markets, while Housing Perks Up
The week started off with a bang as an upturn in new COVID cases jittered financial markets. The Dow Jones Industrial Average fell almost 726 points on Monday, the sharpest one-day drop since last October. The yield on the 10-year Treasury note also fell nearly 10 bps to 1.18%. The drop was somewhat surprising, considering the spread of the Delta variant of the coronavirus is not necessarily breaking news. Cases have been climbing higher in Arkansas, Missouri, Louisiana and Florida for the past few weeks, mostly in areas with low vaccination rates. However, more recently, case counts in nearly every state have started to tick higher. Notably, Los Angeles County has seen an upturn in cases, which has prompted local officials to reimpose indoor mask mandates. Overall, case counts now moving in the opposite direction have raised the possibility that the economic recovery, which is still in its early innings, could be derailed if consumers head back indoors and more restrictions are imposed on businesses.
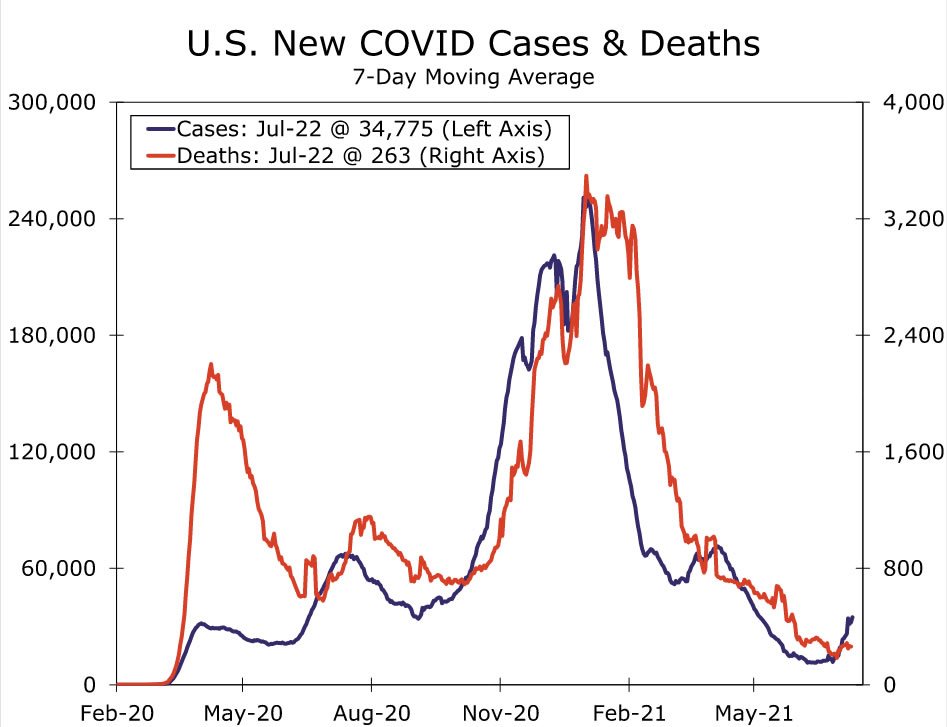
Financial markets mostly bounced back as the week moved on, as fears of a significant slowdown in economic growth were assuaged by better public health outcomes in Israel and the United Kingdom. Both countries have vaccinated a high percentage of their population and are currently battling a resurgence in cases. However, proportional rises in hospitalizations and deaths have not yet occurred, meaning vaccinations appear to be limiting the severe outcomes that would necessitate renewed restrictions. In the United Kingdom, officials pressed ahead with fully unwinding restrictions even with case counts ascending higher. For those reasons, at present, we do not anticipate a substantial slowdown in economic growth stemming from another COVID wave. That noted, we have recently adjusted our interest rate forecast to reflect the trend decline in longer-dated Treasury yields since the start of April. For more on the update to our interest rates forecast, please see the Interest Rate Watch.
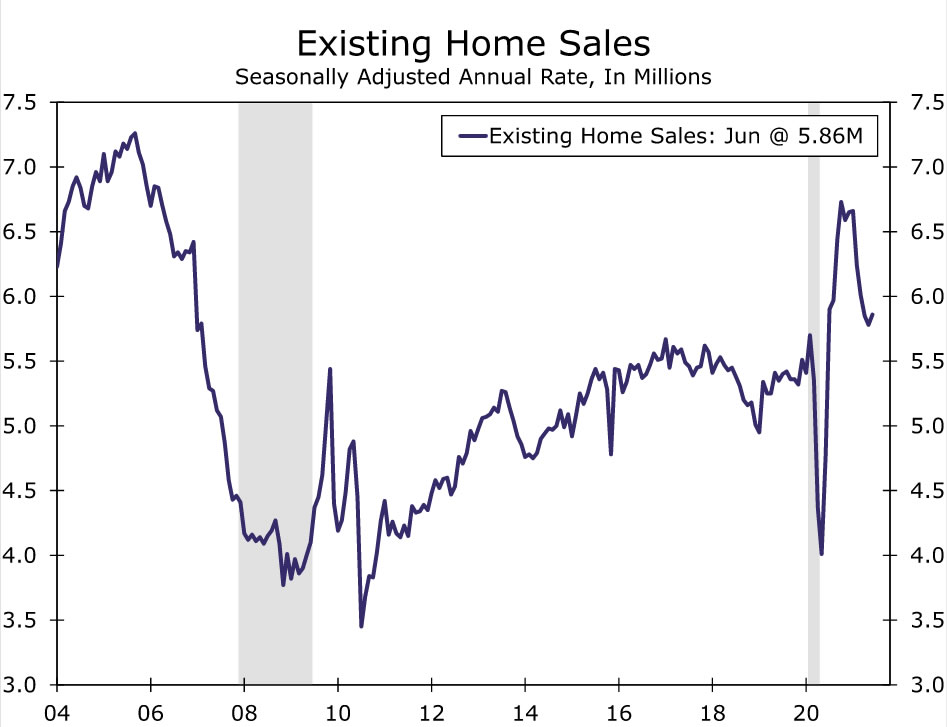
Elsewhere, housing activity appears to be stabilizing after slipping over the past few months. Existing home sales ended a four-month string of declines and rose 1.4% during June to a 5.86 million-unit pace. The turnaround is a reminder that, while home buying activity has cooled off this year alongside shrinking inventories and skyrocketing prices, underlying demand for homes remains strong. Home building also improved during June. Housing starts rose 6.3% during the month to a 1.643 million-unit pace, with both single-family and multifamily starts rising solidly. Building permits dropped for the third straight month. However, permitting has been running well ahead of starts, and some easing is not surprising, as home buying activity has cooled off a touch and building materials remain hard to come by. The increases in new home construction and apartment development are nevertheless encouraging signs that home builders are pushing through the headwinds of soaring material costs, qualified labor shortages and scarce buildable lots.
Home builders are not alone in facing supply-side challenges. Supply bottlenecks continue to constrain activity in most industries, which is holding back a stronger rebound in economic growth. The Leading Economic Index (LEI) improved 0.7% during June. The LEI arguably would have climbed even higher, however, were it not for the drop in building permits and a cutback in hours worked in the manufacturing industry, where supply chain disruptions have significantly curtailed activity. Still, most components of the index gained during the month. The improving labor market again boosted the overall index, as initial jobless claims declined throughout June. However, initial jobless claims, which rose to 419k for the week ended July 17, have been ticking higher so far in July. Considering that job openings remain near a record high, and as most industries continue to report difficulties staffing open positions, the upturn in claims is likely just residual noise surrounding the long Independence Day weekend as well as seasonal adjustment issues. Overall, the monthly rise in the LEI shows that the economic expansion, while showing signs of moderation due to supply constraints, is still fully intact.
U.S. Outlook
Durable Good Orders • Tuesday
We suspect durable goods orders advanced 2.3% in June. The gain in orders should be led by a jump in aircraft, based on monthly orders data from Boeing. Excluding transportation, durable goods orders likely advanced a more modest 0.8% last month.
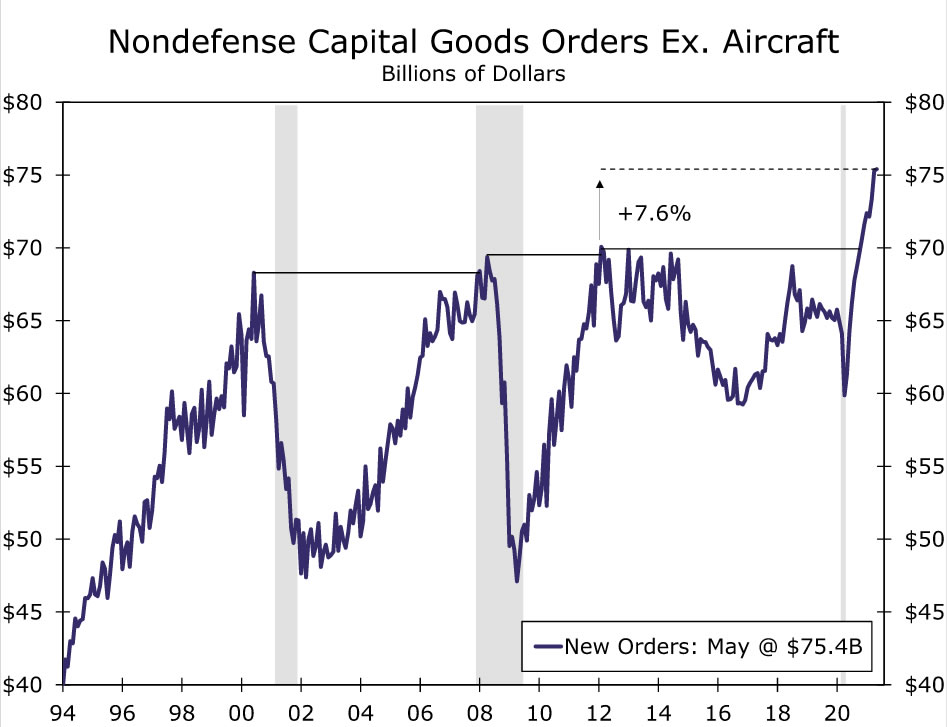
We’ll be paying close attention to core capital goods orders, which exclude defense spending and aircraft orders. This measure reflects underlying business demand, and the trend has been impressive in recent months (see chart). We expect it to again indicate solid investment as businesses try to capture soaring demand, and it will be the final indication of Q2 capital investment before the official data for the quarter are released on Thursday.
If orders come in worse than expected for June, it could reflect caution among businesses, reflecting ongoing supply issues, bubbling price pressures and sagging demand. A better-than-expected outturn, however, would indicate that despite recent bottlenecks, demand remains solid heading into the third quarter.
Q2 Real GDP • Thursday
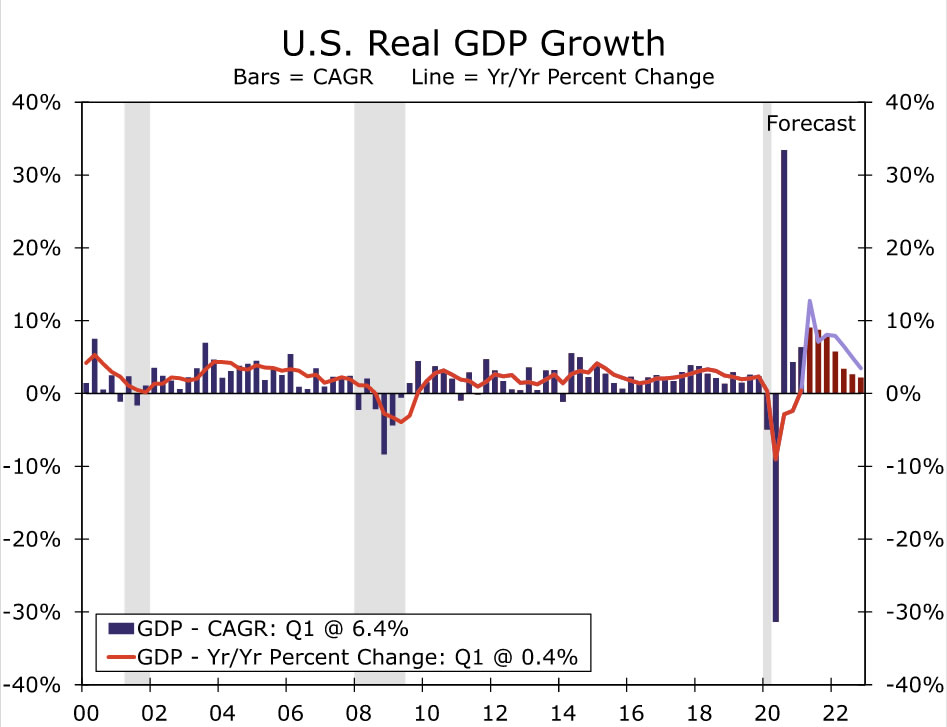
We forecast the U.S. economy expanded at a 9.1% annualized pace in the second quarter, which puts us above the Bloomberg consensus expectation for an 8.5% gain. The National Bureau of Economic Research (NBER), the official arbitrators of recession dating, announced this week that April 2020 marked the end of economic contraction. The pandemic-induced recession therefore lasted just two months, but left a gaping hole in output. Since the Q2 trough in activity, however, the U.S. economy has come roaring back. If our forecast is realized, the level of Q2 real GDP would crest 1.3% above its pre-pandemic Q4-2019 peak.
Overall, the second-quarter details should show a broadening recovery over the past three months. Consumer spending was likely a bright spot. Consumers are flush with cash, and the lifting of mask mandates in mid-May amid the broader reopening of the service sector has unleashed pent-up demand for many in-person services unable to be accessed during the pandemic. Business fixed investment spending should also be strong based on the recent trend in core capital goods orders. Furthermore, the combination of businesses’ strong financial positions and struggles to meet current demand with existing capacity and staff will continue to support investment. Strained supply chains and insufficient shipping space remain as headwinds, however, and will likely lead to another decline in inventories and result in a pretty neutral force coming from net exports for the quarter. Despite the recent moderation in home sales, the housing sector appears to have had a pretty strong quarter of growth as well. The second quarter likely marks the peak rate of growth (see chart), but the drivers of recovery remain more or less intact and suggest growth should still remain strong into next year.
Personal Income & Spending • Friday
On Friday, personal income & spending data for the month of June will be released. We forecast personal income slipped 0.2%, while spending was up 2.0% compared to May.
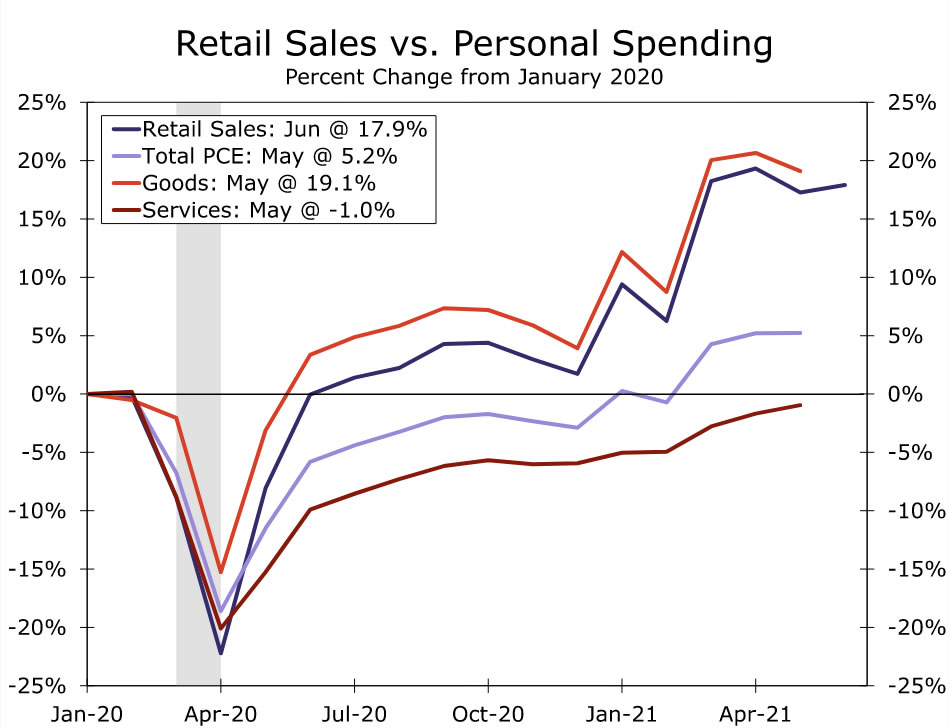
Income growth will again be held back by the effects of dwindling stimulus. Excluding transfer payments, personal income looks set to rise around 0.5%, boosted by continued growth in employee compensation amid the recent pickup in wage growth. Our focus will be on the spending side of the report. The better-than-expected 0.6% gain in June retail sales bodes well for the goods side of spending (see chart), and based on high-frequency data, we remain confident that consumers unleashed some pent-up demand for services last month, which should drive spending higher.
However, there is growing evidence rising prices may soon eat into consumers’ purchasing power, and we’ll also be paying close attention to the PCE deflator in next week’s release. We forecast the core PCE deflator rose 0.5%, which would push the year-ago rate to 3.6%, the highest in 30 years. While it seems clear that inflation is here, it remains uncertain how high inflation will run and for how long. Transitory or not, consumers are certainly taking note of recent price gains and inflation appears to be taking a toll on consumer sentiment.
International Review
ECB’s Easing Measures Going Nowhere Fast
In the United States, discussions have heated up about when the Federal Reserve will taper its asset purchases. Financial markets seem prepared for tapering to occur over the course of 2022, with the first rate hike fully priced into markets by roughly the spring of 2023. When monetary policymakers at the European Central Bank (ECB) met this week, they made clear monetary policy tightening is still a long ways off. The ECB reaffirmed that its pandemic-related bond buying (deemed “PEPP” or pandemic emergency purchase program) will continue until at least the end of March 2022. Separately, net purchases under the asset purchase program (APP) will continue at a monthly pace of €20 billion “as long as necessary to reinforce the accommodative impact of its policy rates.”
Changes to the ECB’s policy rates appear even more distant in light of the central bank’s changes to its inflation target. The changes to the central bank’s inflation framework are a mouthful, but in short, the ECB is treating the 2% mark as more of a symmetric target than it had been previously. The ECB pledged to keep rates at present levels or lower “until it sees inflation reaching two percent well ahead of the end of its projection horizon…and it judges that realized progress in underlying inflation is sufficiently advanced to be consistent with inflation stabilizing at two percent over the medium term.”
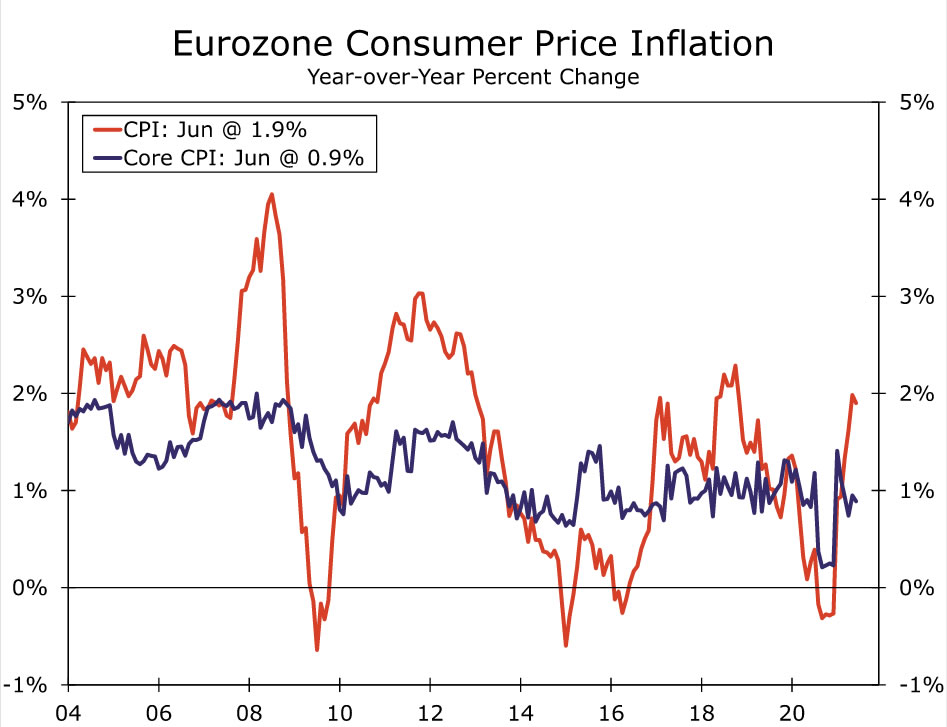
Pushing inflation up to 2% on a sustained basis in the Eurozone will likely be a real challenge. Core CPI inflation last registered 2.0% on a year-over-year basis in March 2008, and even then it was exactly 2.0%, and it only remained at that level for one month. So far, inflationary pressures from COVID reopenings have been much more muted in the Eurozone than in the United States, but perhaps this will change. The ECB’s June projections have headline inflation peaking at 2.6% in Q4-2021 but then receding to 1.5% in 2022 and 1.4% in 2023. If these projections prove correct, and if the rules of the road are that rate hikes will not occur until inflation has hit 2% and stabilized, rate hikes are several years away for the ECB.
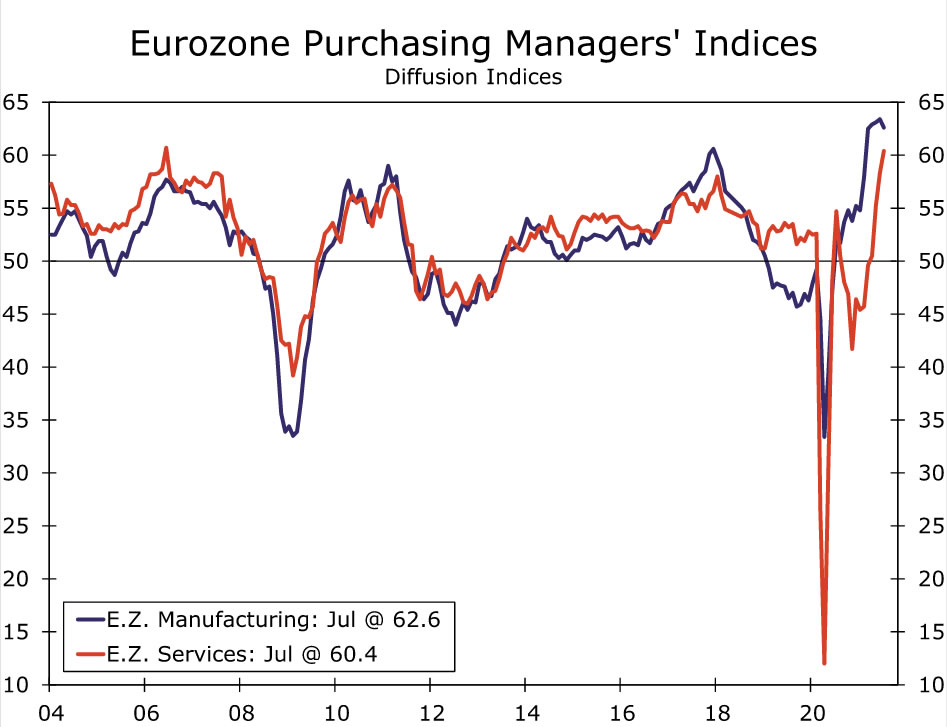
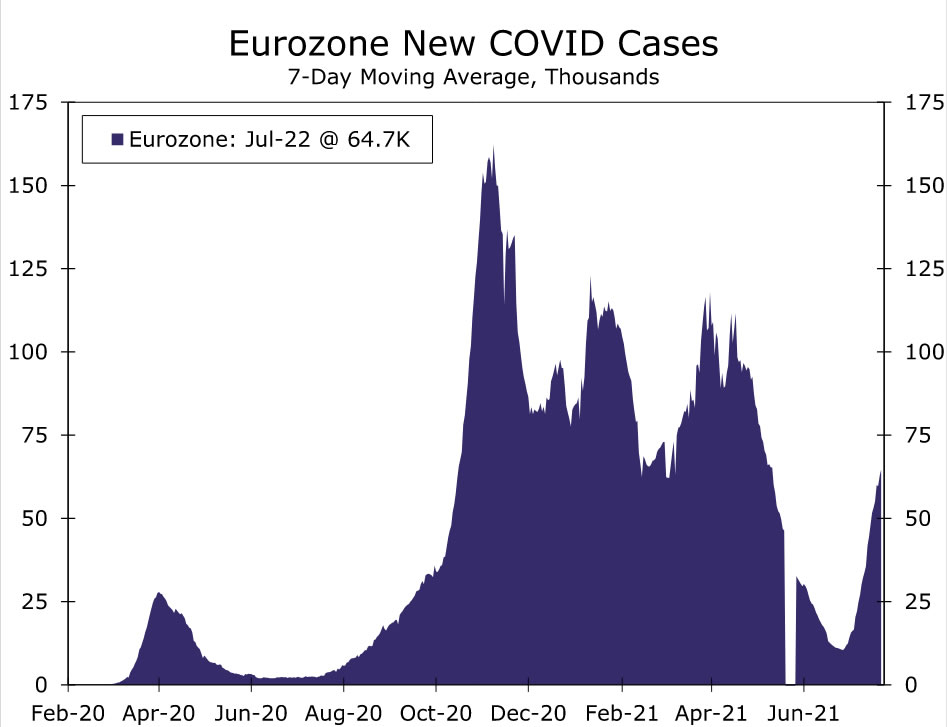
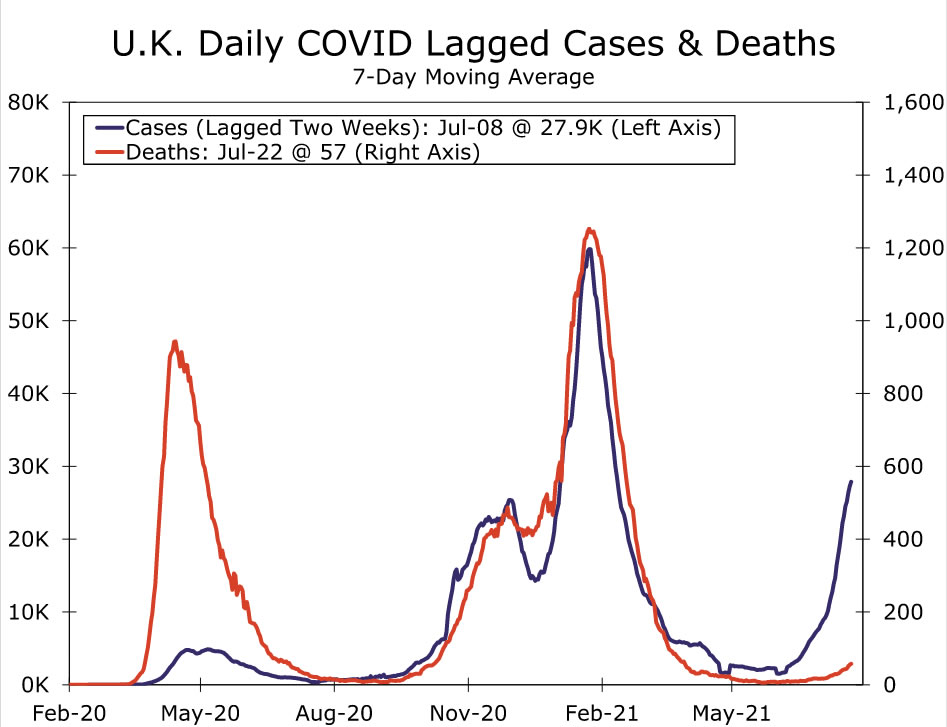
Fortunately, it is not all doom and gloom in Europe. The preliminary PMIs for the Eurozone were released this morning and showed that the manufacturing sector continues to boom. At 62.6, the manufacturing PMI remained above 60 for the fifth straight month. The services component was not quite as strong at 60.4, but it has increased every month of 2021 and remains well above the expansion/contraction demarcation line of 50. COVID cases are trending higher in the Eurozone and have spiked sharply in a handful of countries, such as Spain (see chart). Encouragingly, even though cases have also spiked in the United Kingdom, which was hit by the Delta variant early on, so far, deaths have remained low even after accounting for the lag between the two series (see chart). This provides some promising real world evidence that, even if the vaccines are imperfect against Delta variant infections, they remain robust at preventing serious cases of illness. This in turn bodes well for the ongoing recovery in the Eurozone and elsewhere.
International Outlook
Canada CPI • Wednesday
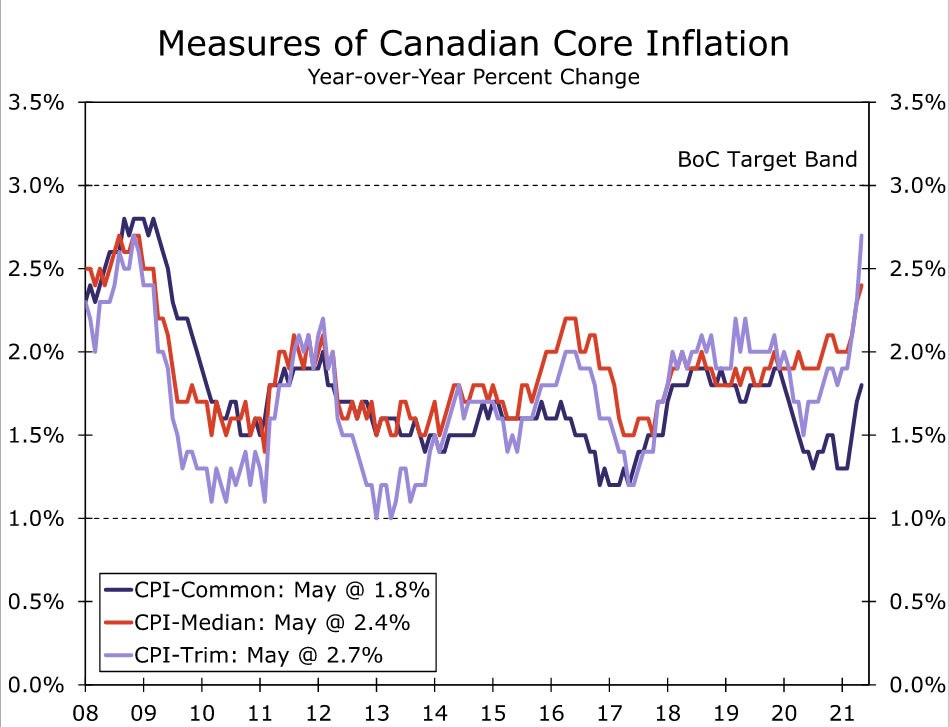
Like its southern neighbor, Canada has experienced consumer price acceleration over the past few months. CPI inflation was 3.6% year-over-year in May as base effects, higher gasoline prices and pandemic-related bottlenecks pushed inflation higher. Like the United States, Canadian monetary policymakers have taken a relatively benign stance on the faster pace of inflation. The July 14 statement from the Bank of Canada stated that “inflation is likely to remain above 3 percent through the second half of this year and ease back toward 2 percent in 2022, as short-run imbalances diminish and the considerable overall slack in the economy pulls inflation lower. The factors pushing up inflation are transitory, but their persistence and magnitude are uncertain and will be monitored closely.”
Measures of “core” inflation in Canada vary methodologically with the most closely followed measures of core inflation in the United States. This in part explains why core inflation in Canada has not shown quite the same pick-up as it has in the United States. However, the BoC appears poised to move a bit sooner than the Federal Reserve. Markets are pricing in the first rate hike from the BoC for sometime in the first half of 2022, nearly a year before markets are priced for the first rate hike from the Federal Reserve.
Eurozone GDP • Friday
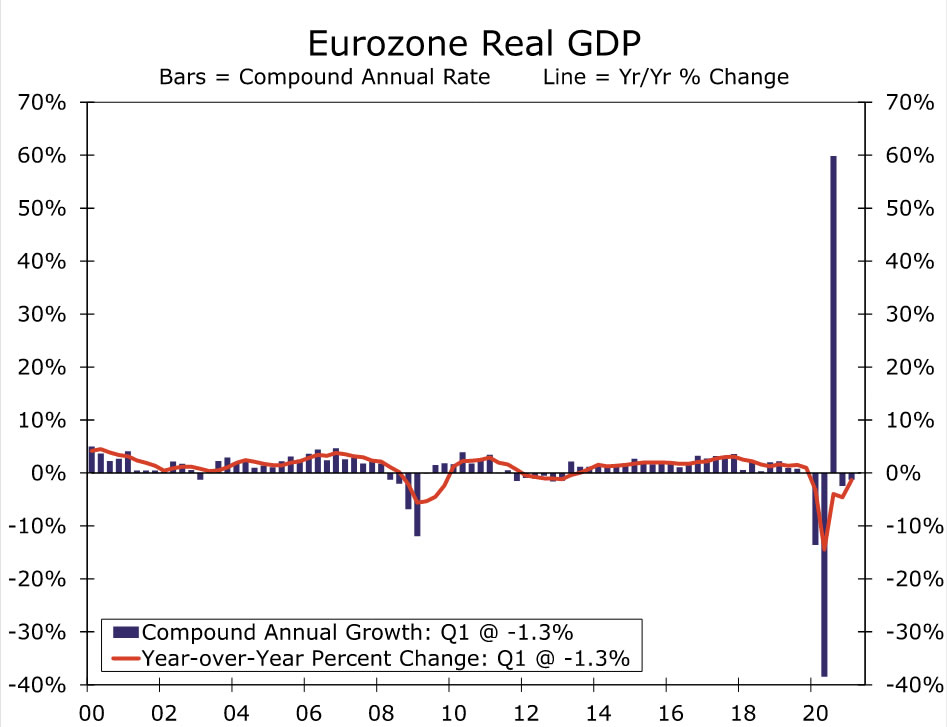
Next Friday, data is to be released for economic growth in the Eurozone for the second quarter. Q2 started slowly in Europe as many countries on the continent had to delay reopening plans amid persistently high COVID cases and a slow initial vaccine rollout. Later in the quarter, however, the Eurozone economy found its groove as vaccine access expanded and better weather emerged. Our expectation is that Q2 real GDP growth in the Eurozone will be about 6% on a quarter-over-quarter annualized basis.
We think real GDP in the Eurozone should accelerate further in Q3 now that vaccines are more widely available and restrictions have been largely lifted, although there are some risks to that view as we discussed in the international review. Still, the Eurozone recovery has a lot of ground to make up on the United States. If our Q2 GDP forecasts are approximately correct, U.S. real GDP will have surpassed its pre-pandemic high, while the Eurozone economy will still be about 3.5% smaller than its pre-COVID peak.
Interest Rate Watch
Faster Growth and Inflation, Tapering Ahead, but Lower Rates?
On March 31, the yield on the 10-year Treasury security finished the day around 1.75%, a sharp increase from roughly 0.90% at the start of the year. Since then, yields on longer-dated Treasury securities like the 10-year have fallen. At present, the yield on the 10-year Treasury is just 1.30%. Accordingly, we have reduced our year-end target for the 10-year Treasury yield from 2.00% to 1.75%. Identifying the culprit for this move lower in rates requires a bit of sleuthing. Since our mid-March forecast update, our projection for real GDP growth in 2021 has increased by 0.6 percentage points, while our forecast for economic growth in 2022 is more or less unchanged. Our forecasts for inflation in 2021 and 2022 have increased by about a percentage point over the same period.
More robust economic growth and inflation are not usually associated with lower yields, so perhaps a more dovish Federal Reserve is to blame. However, market pricing for the first rate hike has not changed much since March 31. If anything, the timing of the first hike has been pulled forward rather than pushed back. Expectations for the Federal Reserve to begin tapering around year-end have also been reasonably well-anchored for the past few months. So what gives?
One clue can be found in the decomposition of the nominal 10-year Treasury yield into its inflation component and its “real” component. Market-based inflation expectations for the next 10 years have declined only a little since March 31. If nominal yields have fallen and markets expect roughly the same pace of inflation as before, this implies inflation-adjusted or “real” yields have declined.
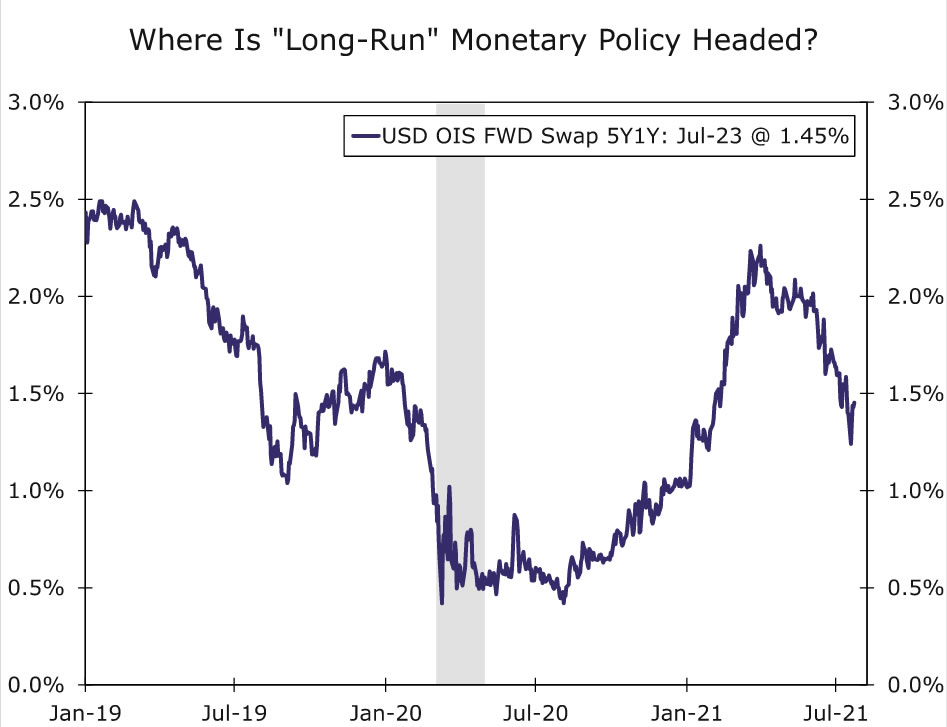
Perhaps the main driver of lower real yields is not near-term questions about the timing of tapering or the first rate hike, but rather deeper questions about the impending tightening cycle more broadly. A broad consensus seems to have formed that the Fed will taper its purchases for most of 2022 and then hike 1-3 times in 2023. But what comes next? A sustained, multiyear period of tightening up to the “long-run” dot of 2.50%? Or a much lower eventual endpoint to reflect the Federal Reserve’s structural shift in how it thinks about its employment and inflation mandates?
The chart to the right illustrates roughly what markets have priced for the effective fed funds rate for the one-year period starting five years from now, or roughly mid-2026 through mid-2027. When the 10-year Treasury yield peaked in late March, markets were pricing a fed funds rate of roughly 2.25% for that one-year period five years out, not too far from the FOMC’s “long-run” dot of 2.50%. Fast-forward to today and market pricing has tumbled to less than 1.50% for roughly the same period. Ultimately, we think 1.50% is a little too low for the nominal long-run rate, and we still think longer-term yields will head higher over the next year or so to better reflect this fact. However, the past few months illustrate that it will probably not be a linear path higher, and we have adjusted our rates forecast to reflect this reality.
Credit Market Insights
Will Canada’s Housing Market Sustain Its Frothiness?
Around the world, house prices have been soaring, primarily due to large discrepancies in home supply and demand. The supply chain issues created by the pandemic, which pushed up input costs dramatically, have coincided with increasing demand for space after more than a year at home. Canada has emerged as one of the frothiest housing markets in the world. The average price of an existing home in Canada is just over $529,000 (seasonally adjusted) as of this June, which is up 0.1% (seasonally adjusted) from May and a staggering 25.9% from a year ago. In addition, new home prices were up 0.6% from May and 11.9% from last year. This represents the largest year-over-year increase in new home prices since 2006, just before the housing bubble burst and the ensuing 2008 financial crisis. With its stronger regulations and more conservative lending practices, Canada experienced milder effects from the 2008 financial crisis than the U.S., and none of its major financial institutions failed. More recently, however, it seems that mortgage lending standards have softened.
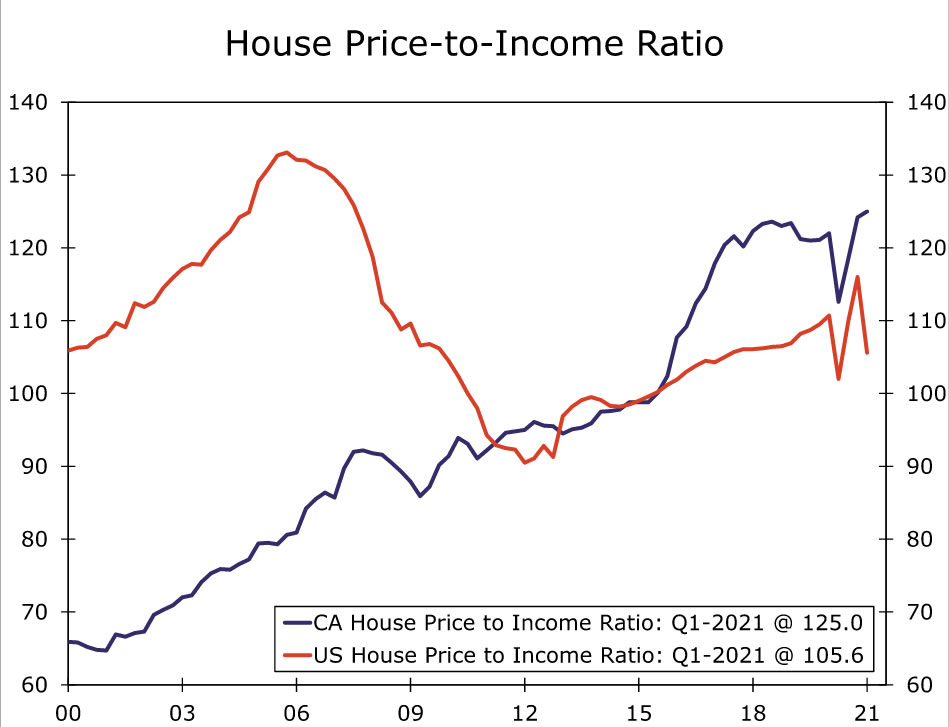
Rising home prices, particularly over the past year, have made it difficult for entry-level buyers to cover the standard 20% down payment. Canada’s house price-to-income ratio was at a two-decade high of 125 in Q1-2021, approaching the U.S. house price-to-income ratio of around 133 seen just before the housing bubble burst in Q4-2005. As housing has become less affordable, mortgage lending conditions have eased in each of the past three quarters, according to the Bank of Canada’s Senior Loan Officer Survey. In the fourth quarter of 2020, 17% of new home loans had a loan-to-income ratio greater than 4.5%, compared with 6.5% two years earlier. In addition, more Canadians are being approved for mortgages that don’t require them to put down any money at closing. Although zero-down loans make up a small percent of overall new home loans, it is clear that lending practices in Canada have loosened.
Despite the frothy housing market and riskier lending at the margins, as of Q1-2021, mortgage default rates are tied for a nine-year low at 0.25%. However, given that most Canadian mortgages reset rates every five years, borrowers could face higher mortgage costs in the coming years. With the economy recovering and inflation moving higher, up 3.6% in May from year ago, Canada’s Central Bank is already paring back its quantitative easing program, and we expect it to raise its benchmark rate next year. With mortgage rates moving higher, affordability concerns could become more acute. That said, we expect 2021 to be a strong year for the Canadian economy and continued income growth should help offset the increasing debt burden.
Topic of the Week
Housing Is Moving Back into Balance
Home sales and building activity had extraordinary momentum leading into this year. Low mortgage rates and shifting preferences toward more living space fueled demand amid a shortage of homes available for sale. With supply and demand so off-kilter, home prices have surged to record levels this year. Meanwhile, sharply rising material and labor costs have pushed home builders to tap the brakes on construction. While declining affordability and supply shortages have pressured housing activity in recent months, we believe the housing market is now beginning to come back into balance.
We look for a modest rise in home sales during the second half of this year and forecast existing and new home sales to rise 6.5% and 9.9%, respectively, in 2021. Our outlook is predicated on strong underlying demand despite rising affordability challenges. The housing market continues to enjoy a strong demographic tailwind, with a growing number of millennials reaching a point in their lives where they are marrying, having children and buying a home. Higher existing home prices are also bringing out more sellers, which is helping to improve the supply picture. With more homes on the market, bidding wars and price appreciation are set to moderate somewhat. Home prices will continue to rise solidly, however, and we look for the S&P CoreLogic Case-Shiller National Home Price Index to rise 12.6% this year, although the risk is tilted to the upside.
Moreover, mortgage rates are likely to remain low this year, which should help offset higher prices and reinforce strong demand from entry-level buyers. The 30-year fixed-rate mortgage rate has hovered around 3.0% over the past few weeks and appears to be drifting lower. Mortgage rates tend to follow 10-year Treasury yields, which we expect will finish 2021 around1.75%. Similarly, we look for mortgage rates to end the year at 3.25%.
Home construction is also set for a rebound. Builders have a growing backlog of projects that are slated to move forward once supply and labor shortages ease. Lumber prices have plummeted around 70% since early May and may drop further as more sawmills reopen and boost shipments. Price appreciation for other key materials is also starting to ease up slightly, although it may take some time to flow through to builders.
Despite these headwinds, home builders remain relatively upbeat. The NAHB/Wells Fargo Housing Market Index (HMI) fell one point to 80 in July, but remains elevated relative to its long-term average. The ongoing strength in the HMI suggests construction will remain robust this year. We are looking for single-family starts to rise 17% in 2021, with much of the gain coming from the South and parts of the West.
Multifamily development is expected to strengthen as well. Demand for apartments has improved across the country, especially in hard-hit urban markets. The long-awaited return to the office is now under way, which is providing a boost to construction in markets such as New York City, Austin and Seattle. Multifamily starts are expected to rise 8.2% this year to 425,000 units, most of which are rental apartments.
The resurgence of new COVID cases presents some risk to our housing forecast. The resurgence could delay the reopening of schools and the return to the jobsite. While consumer and building activity have not yet reacted in a meaningful way, we will be monitoring this risk closely. For more detail, please see our recently published Housing Chartbook.


