The price of crude oil moved sideways after positive crude oil inventories data from the United States. According to the Energy Information Administration (EIA), inventories declined by more than 4.71 million barrels last week. This was a deeper drawdown than the median estimate of 2.7 million barrels. It was also bigger than the American Petroleum Institute (API) estimate of 3.6 million barrels Oil prices also held steady after countries like the US and UK announced more policies to curb the spread of the Omicron variant. For example, the UK announced more orders of drugs by Merck and Pfizer.
The US dollar index was relatively unchanged as the market reflected on the latest economic data from the United States. The Conference Board published strong consumer confidence data. The number showed that confidence rose from 111.9 in November to 115.8 in December. This was a bigger increase than analysts were expecting. Further data showed that the existing home sales rose from 6.34 million to more than 6.46 million. Additionally, the country’s statistics agency said that the economy expanded by 2.3% in the third quarter. Later today, the key data to watch will be the latest US durable goods, inflation, new home sales, and initial jobless claims numbers.
US equities were in the green on Wednesday as volume declined. The Dow Jones index rose by more than 135 points, while the S&P 500 and Nasdaq 100 indices rose by more than 0.50%. This made it the second straight day of gains after the equities crashed hard on Monday. This performance was tied to strong US economic numbers and the fact that the Omicron variant’s symptoms don’t look severe. A study published on Wednesday showed that the illness has an 80% lower risk of hospitalization.
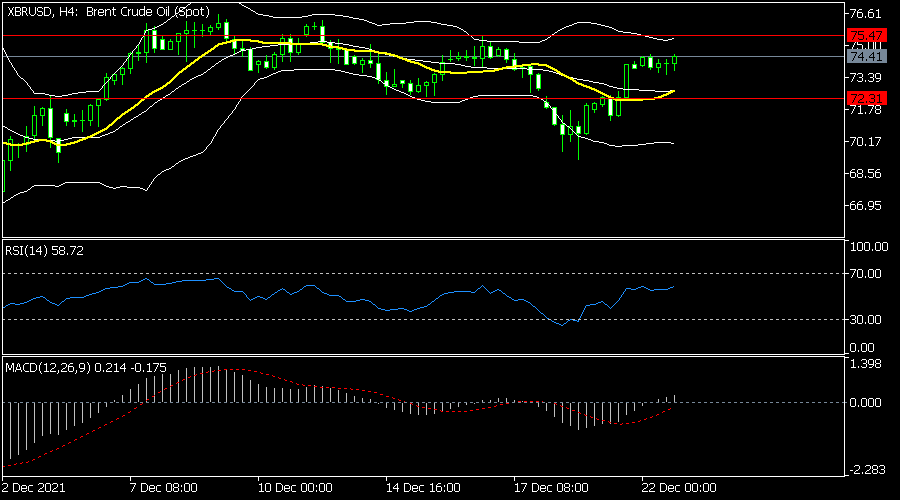
XBRUSD
The XBRUSD pair tilted higher in the evening session. The pair rose to a high of 74.40, which was significantly higher than last week’s low of 69.24. It has also moved slightly above the middle line of the Bollinger Bands. Oscillators like the Relative Strength Index (RSI) have moved to the neutral level. It has also formed a small bullish flag pattern. Therefore, the pair will likely keep rising as bulls target the key resistance at 75.50.
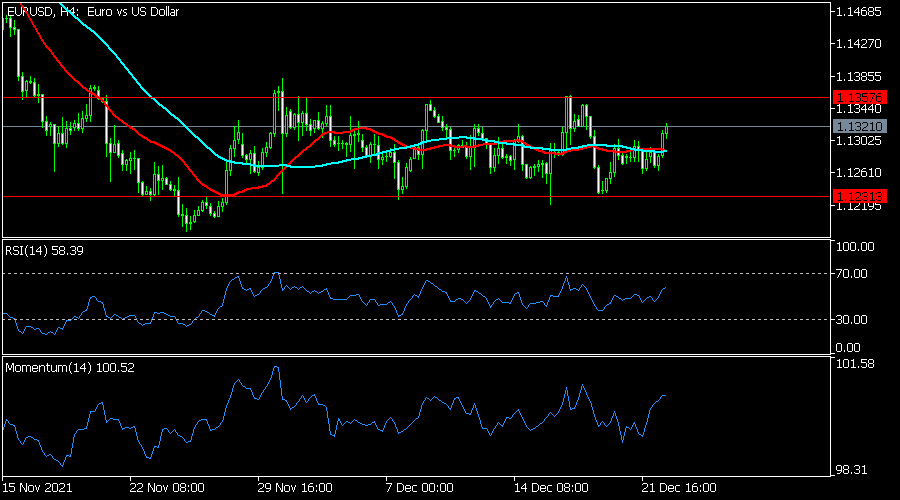
EURUSD
The EURUSD pair rose to a high of 1.1323, which was the highest level since December 17th. On the four-hour chart, the pair moved slightly above the 25-day moving average. It is also still slightly below the upper side of the rectangle channel. The RSI and the momentum oscillator also moved slightly higher. Therefore, the pair will likely keep rising as bulls target the key resistance at 1.1357. This price is along the upper side of the rectangle pattern.
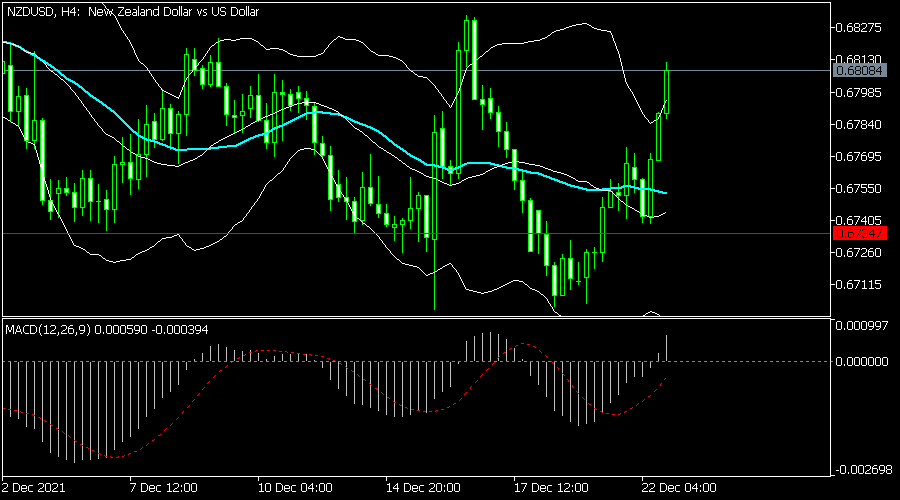
NZDUSD
The NZDUSD pair rose to 0.6810, which was the highest level since December 16th. The price is significantly above the key support at 0.6735, which was the lowest level on December 4. The pair moved above the 25-day moving average and is along the upper side of the Bollinger Bands. The MACD also moved slightly above the neutral level. Therefore, the pair will likely keep rising later today.