
Summary
The outlook for U.S. monetary policy has shifted significantly in recent months. Inflation remains well-above the Federal Reserve’s 2% target, while the labor market recovery has continued at a much stronger pace than occurred in the 2010s expansion. A more robust recovery in output, employment and prices in this cycle has translated into a much quicker pivot from the Federal Reserve on monetary policy. Markets are increasingly priced for the first fed funds rate hike in March, and our forecast agrees with this view. Several more rate hikes later this year and in 2023 appear likely.
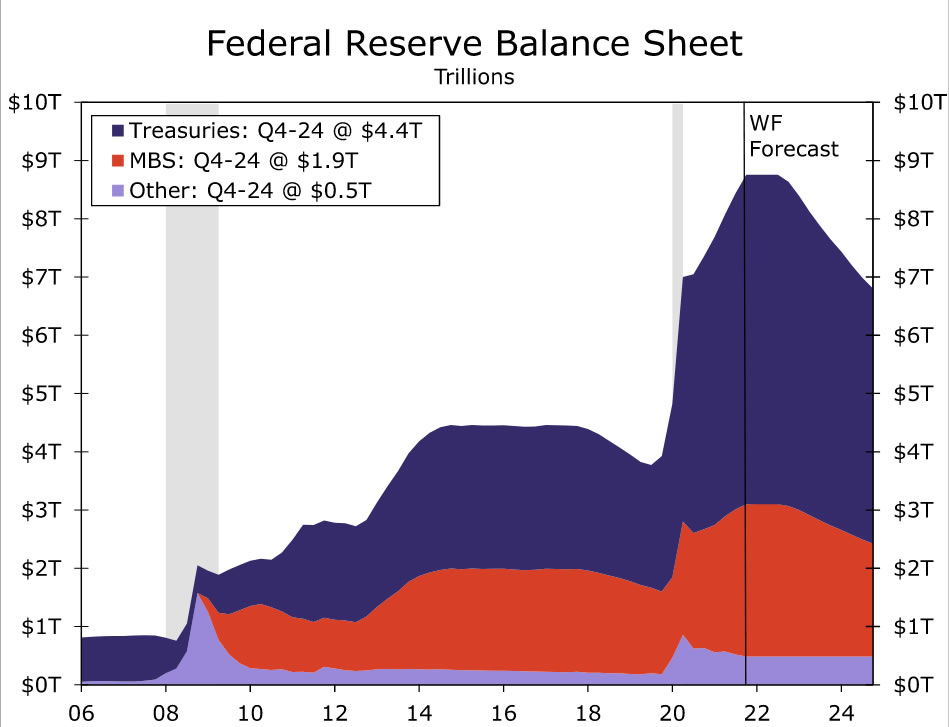
With tighter monetary policy on the horizon, market attention has turned to possible reductions in the Fed’s asset holdings, which total nearly $9 trillion at present, up from $4.2 trillion before the COVID-19 pandemic. Our baseline assumption is that the Federal Reserve will announce balance sheet runoff at the September 2022 FOMC meeting, with the actual runoff beginning one month later in October. Unlike the 2017 experience, we think the FOMC will also increase the federal funds rate at this meeting to 0.75%-1.00%.
Starting in October, we look for the Fed to stop reinvesting its maturing securities up to a monthly cap much like the central bank did the last time it shrank its asset holdings. We think these caps will be ultimately be $70 billion per month for Treasury securities and $30 billion per month for mortgage-backed securities (MBS). Similar to last time, we suspect the Fed will phase in the runoff, so we have penciled in initial caps of $20 billion and $5 billion per month for Treasuries and MBS, respectively. These caps would then be increased by $10 billion and $5 billion per month from November 2022 through March 2023 at which point the caps would level off at $70 billion and $30 billion. If these caps were kept in place through the end of 2024, we estimate the Fed’s balance sheet would be just below $7 trillion at that point in time. Under this scenario, we project that the Fed’s balance sheet would be 24.4% of GDP in Q4-2024, about the same level that prevailed in mid-2015.
If the Federal Reserve reduces its balance sheet by a couple trillion dollars over 2023 and 2024, this should contribute to the upward creep in yields on longer-dated Treasury securities and mortgage rates that we forecast in coming quarters. Quantifying the impact on Treasury yields from projected Fed balance sheet runoff is highly uncertain, much more uncertain than the pass-through from projected fed funds rate increases. We think the most likely outcome is for upward pressure on long-term Treasury yields, but only moderately so. The structural downward pressure on real long-term interest rates from demographic changes, lower potential GDP growth and elevated global savings remains intense. These factors are reflected in our 2023 year-end forecast for the 10-year Treasury yield of 2.35%.
How Do You Shrink a $9 Trillion Balance Sheet? One Bond At a Time.
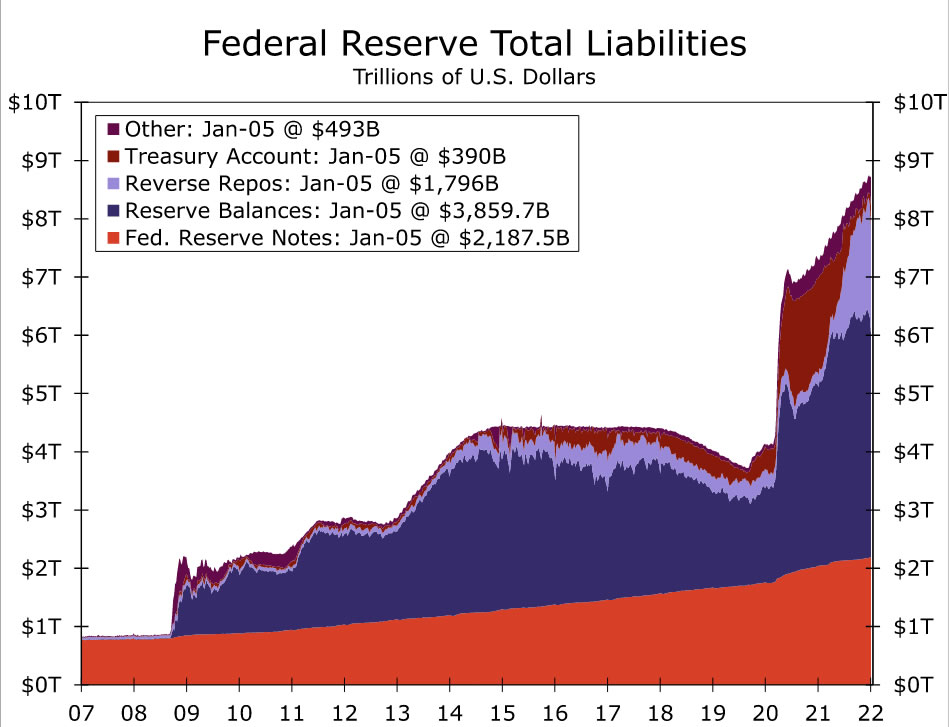
On the eve of the COVID-19 pandemic in February 2020, the Federal Reserve’s balance sheet was about $4.2 trillion. The asset side of the Fed’s balance sheet was composed primarily of Treasury securities and mortgage-backed securities (MBS), while the liabilities side primarily consisted of currency in circulation, bank reserves held at the Federal Reserve and the U.S. Treasury’s general account that it uses for managing daily cash inflows and outflows (Figures 1 & 2).
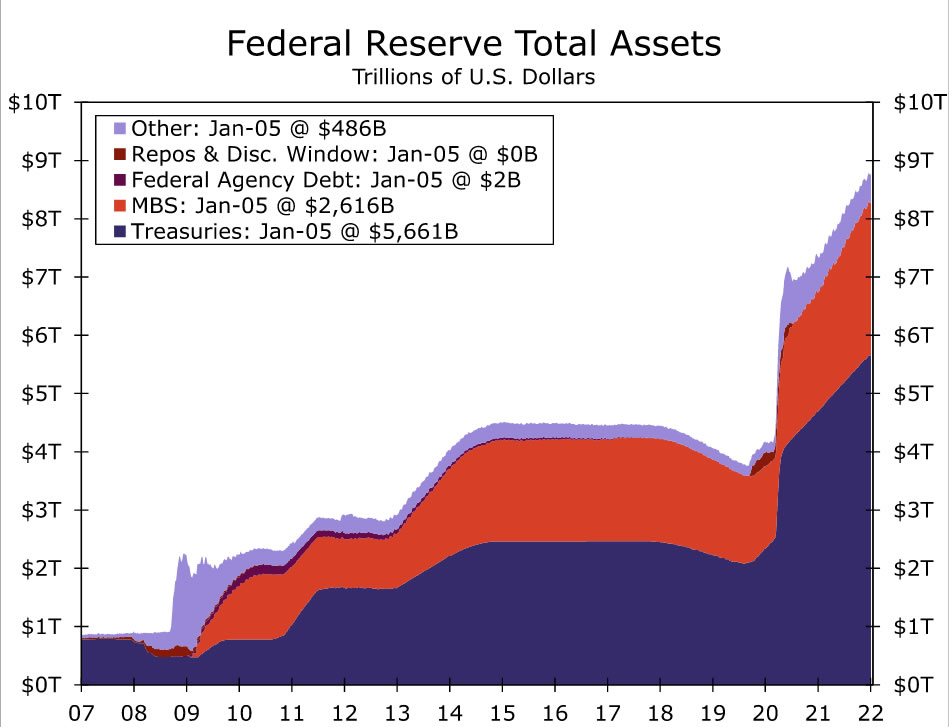
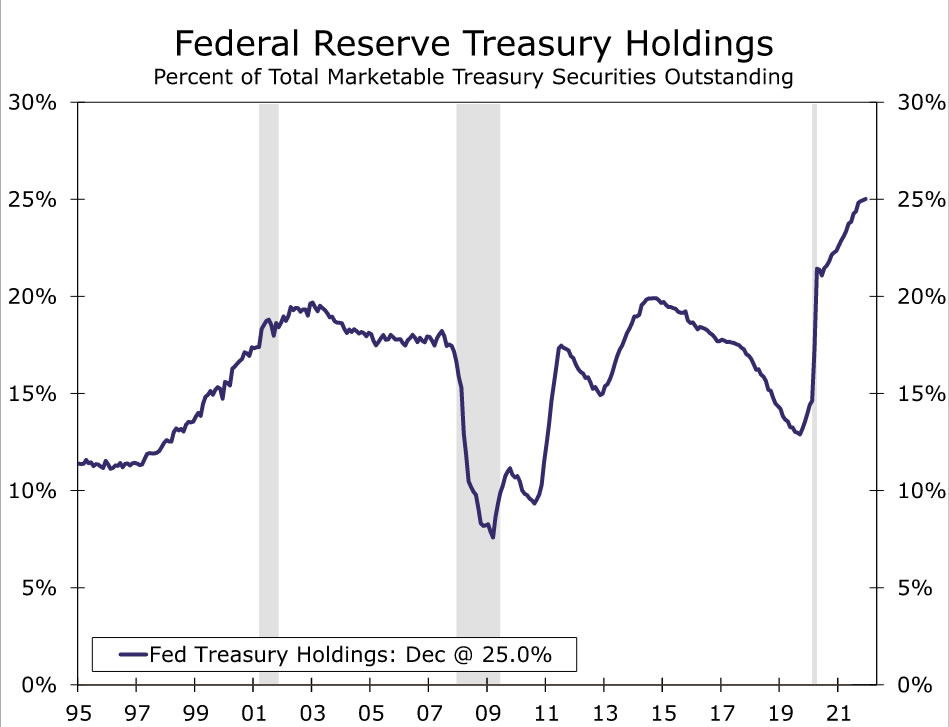
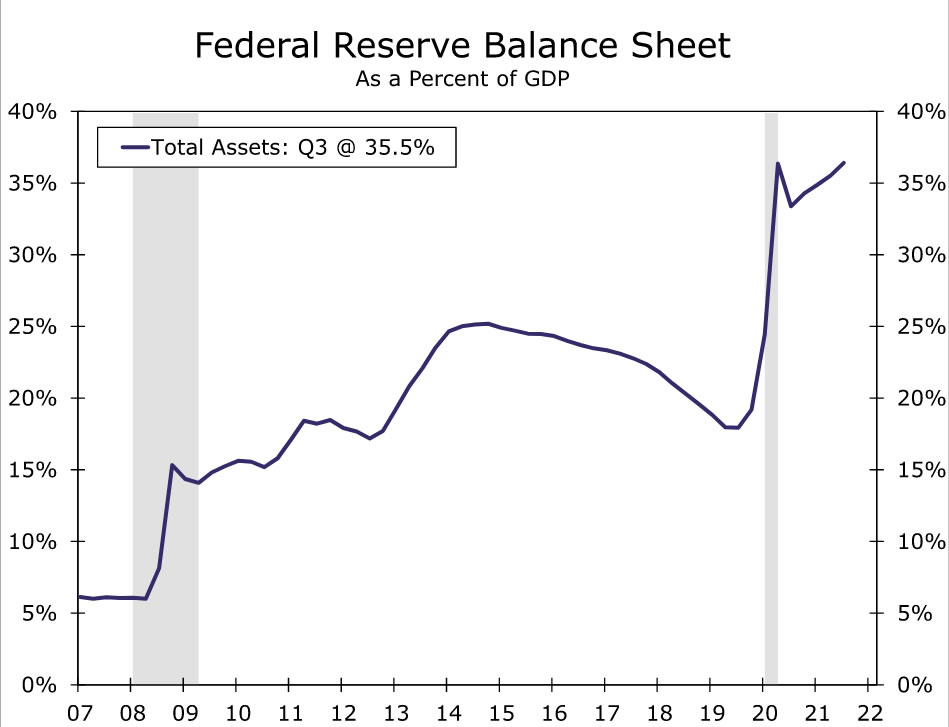
In some ways the Fed’s balance sheet had normalized from the 2008-2009 recession. For example, the Federal Reserve owned 14.6% of total Treasury securities outstanding in February 2020, which was lower than the share it held in 2007 (Figure 3). However, the central bank still owned $1.4 trillion in MBS, an asset it did not hold before 2008, and the Fed’s total assets as a share of GDP were about 18%, three times the level that prevailed in 2007 (Figure 4). Still, the Federal Reserve was in the process of gradually reinvesting its MBS holdings into Treasury securities, and steady economic growth was permitting the central bank to further “grow into” its sizable holdings. The central bank seemed to be slowly but surely reaching a new equilibrium for its balance sheet.
The pandemic upended that narrative entirely. The Federal Reserve bought trillions of dollars worth of Treasury securities and MBS to provide monetary policy stimulus to the economy and backstop deteriorating financial markets. It also provided a significant amount of additional support and liquidity through repurchase agreements, swaps with foreign central banks and non-traditional asset purchases/loans to businesses and municipal governments. As a result, the Fed’s balance sheet has subsequently ballooned to nearly $9 trillion today.
Due, at least in part, to the Fed’s actions the U.S. economy is in a much different place today than it was earlier in the pandemic. Nonfarm payrolls have recovered about 84% of the total jobs lost during the early stages of the pandemic, and total U.S. output now exceeds its pre-pandemic level. In addition, inflation has surged above the Fed’s 2% target and appears likely to remain above target for most of 2022, if not longer. A much more robust recovery in output, employment and prices in this cycle compared to the 2010s has translated into a much quicker pivot from the Federal Reserve on monetary policy. In November, the Fed announced it would start slowing its bond purchases, with an eye toward ending purchases completely in June 2022. Just six weeks later the central bank began reducing its bond buying even more rapidly. Markets are increasingly priced for the first fed funds rate hike in March, and our forecast agrees with this view. Several more rate hikes later this year and in 2023 appear likely.
With tighter monetary policy on the horizon, market attention has turned to possible reductions in the Fed’s asset holdings. Much of the Fed’s non-traditional lending that occurred early in the pandemic, such as central bank swaps and corporate bond buying, has already rolled off the central bank’s balance sheet. However, the Fed’s Treasury securities and MBS holdings are still exceptionally high and in fact are still growing as bond purchases are not set to conclude until mid-March. This has not stopped financial market participants and analysts from speculating about when the Federal Reserve might start shrinking its Treasury security and MBS portfolio. Speculation was further stoked by the release of the minutes from the December FOMC meeting which showed that Fed officials engaged in a preliminary but robust discussion about various options on the timetable regarding balance sheet shrinkage. To better understand what the Fed might do going forward, we first turn to what the central bank did from 2017-2019 when it last reduced the size of its balance sheet.
“Quantitative Tightening”: The 2017-2019 Experience
At the March 15, 2017 FOMC meeting, the FOMC increased the federal funds target range to 0.75%-1.00%. The minutes from that meeting were released a few weeks later and showed the first clear signs that balance sheet reductions were eventually coming: “Most participants judged that a change to the Committee’s reinvestment policy would likely be appropriate later this year.” At that time, the unemployment rate was 4.4%, and the core PCE deflator was 1.9% on a year-over-year basis.
A few months later, the Federal Reserve released a document outlining a tentative plan for balance sheet normalization. In short, the Fed would stop reinvesting maturing Treasury securities and MBS up to a monthly cap. These monthly limits would start at $6B per month for Treasuries and $4B per month for MBS, eventually rising to $30B and $20B, respectively. All proceeds in excess of these limits would be reinvested into their respective securities. At the September 2017 FOMC meeting, the central bank formally announced that balance sheet reductions would begin in October and follow the previously outlined parameters. Notably, the Fed chose not to hike rates at that meeting, holding the fed funds rate steady at 1.00%-1.25%.
From October 2017 through March 2019, the Federal Reserve’s balance sheet shrank by about $500 billion. On the asset side, Treasury securities declined by about $300 billion while MBS holdings fell $200 billion. On the liability side of the balance sheet, bank reserves declined a bit more than $500 billion, essentially accounting for the entire offset. Notably, the Fed did not start this process with an end date or terminal size of the balance sheet in mind. Instead, the plan stated that the Committee “expects to learn more about the underlying demand for reserves during the process of balance sheet normalization.”
And learn more about demand for reserves it certainly did. Upward pressure on a variety of short-term interest rates emerged throughout 2018 as the Federal Reserve shrank its balance sheet. Broadly speaking, this was a sign that bank reserves were becoming scarcer as the price (i.e. the interest rate) to borrow cash overnight rose. At first, the Fed resorted to tweaking the interest rate it pays on bank reserves to keep short-term interest rates well-anchored. However, in March 2019, just a few months after the monthly caps had been fully phased in, the Federal Reserve announced that it would reverse course and begin slowing the pace of decline in its balance sheet. The plan was to stop balance sheet shrinkage entirely by September 2019 and then reinvest principal payments from MBS into Treasury securities. This MBS-to-Treasuries shift would keep the overall balance sheet size unchanged but move the Fed’s asset holdings towards primarily Treasury securities over the long-run.
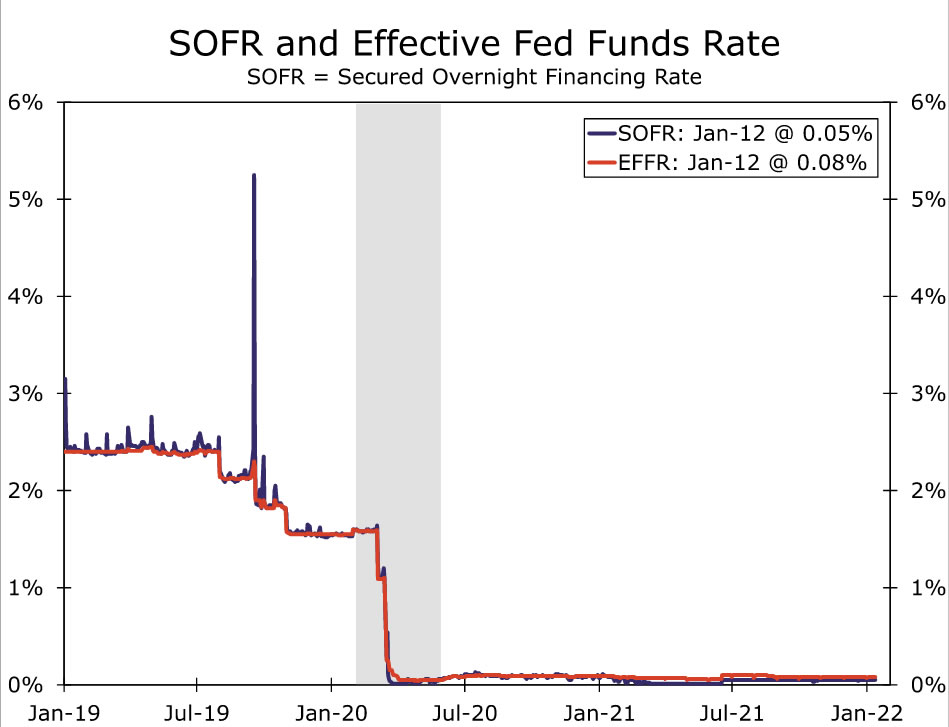
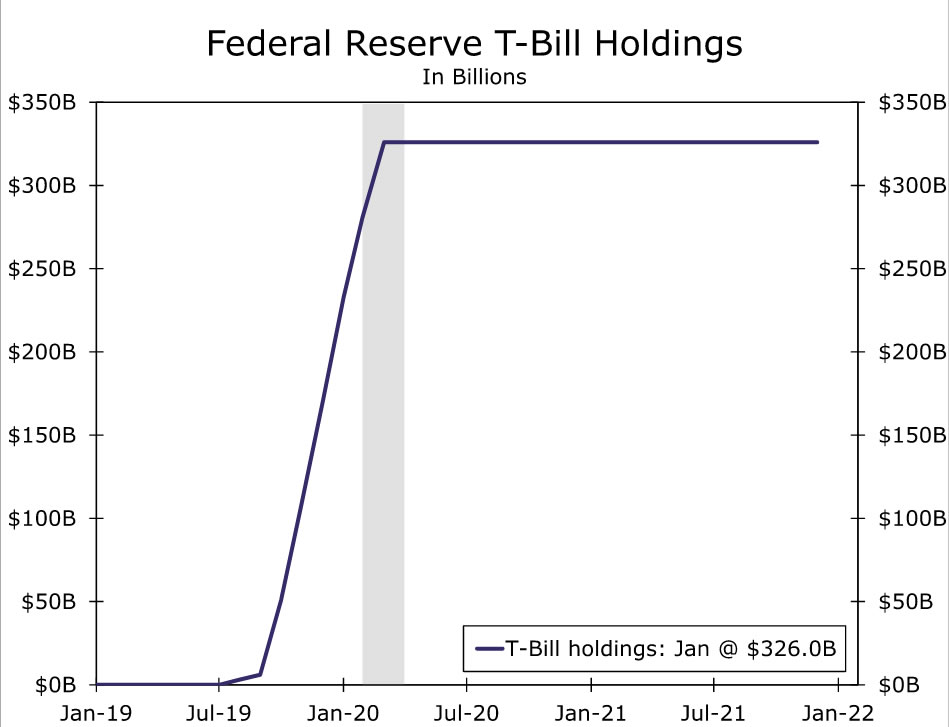
This plan was disrupted in September 2019 when Treasury repo rates exploded, putting significant upward pressure on numerous key short-term interest rates, including the effective fed funds rate and the secured overnight financing rate (SOFR), as shown in Figure 5. Although there were still more than $1.3 trillion in bank reserves held at the Federal Reserve at the time, it became clear that underlying demand for highly liquid, safe cash parked at the Fed was higher than many analysts had previously estimated.1 In response to this disruption, the Federal Reserve started performing overnight and term repo operations to provide additional liquidity to the financial system. The Fed also began modestly increasing the size of its balance sheet again, this time through purchases of Treasury bills, as a means of boosting bank reserves and putting downward pressure on short-term interest rates (Figure 6). Those ad hoc repo operations and T-bill purchases continued until March 2020 at which point the pandemic-induced policy changes reigned supreme.
We Expect Balance Sheet Runoff to Start in Q4-2022
So when and how will the Federal Reserve proceed with balance sheet reductions this time around? Our baseline assumption is that the FOMC will announce balance sheet runoff at the September 2022 FOMC meeting, with the actual runoff beginning one month later in October. Unlike the 2017 experience, we think the FOMC will also increase the federal funds rate at this meeting to 0.75%-1.00%. If realized, a September announcement would come just six months after the end of asset purchases, a sharp contrast to the nearly three years that elapsed between the end of Fed bond buying in December 2014 and the start of Fed balance sheet shrinkage in October 2017. This much faster turnaround from being a net buyer to a de facto net seller makes sense in the context of the much more rapid recovery in employment and inflation seen in this recovery. The unemployment rate is already below 4%, labor demand is strong enough to support solid additional employment gains and headline inflation is an eye-popping 7%.
Starting in October, we look for the Fed to stop reinvesting its maturing securities up to a monthly cap much like the central bank did the last time it shrank its asset holdings. We think these caps will be ultimately be $70 billion per month for Treasury securities and $30 billion per month for MBS. When scaled up for the growth in the Fed’s asset holdings, monthly caps of $70 billion and $30 billion for Treasury securities and MBS, respectively, are roughly equivalent to the $30 billion and $20 billion caps that prevailed in the previous balance sheet runoff experience.
Similar to last time, we suspect the Fed will phase in the runoff, so we have penciled in initial caps of $20 billion and $5 billion per month for Treasuries and MBS, respectively. These caps would then be increased by $10 billion and $5 billion per month from November 2022 through March 2023 at which point the caps would level off at $70 billion and $30 billion. If these caps were kept in place through the end of 2024, we estimate the Fed’s balance sheet would be just below $7 trillion at that point in time (Figure 7). Under this scenario, we project that the Fed’s balance sheet would be 24.4% of GDP in Q4-2024, about the same level that prevailed in mid-2015.
Just how long might balance sheet reductions last? As we noted earlier, the Federal Reserve left this question open-ended during the last runoff period, committing only to “hold no more securities than necessary for efficient and effective policy implementation” over the long-run. Identifying this equilibrium level for the balance sheet proved to be harder than expected as evidenced by the repo market blow-up that occurred in September 2019. Ultimately, the terminal size of the balance sheet is driven by the liability side of the Fed’s balance sheet, particularly the appropriate level of reserves in the system. This in turn is determined by bank demand for holding reserves at the Federal Reserve. Banks hold reserves at the central bank for numerous reasons, including as an optimal place to hold discretionary and legally-required liquidity buffers. If bank reserves decline too much, upward pressure on short-term interest rates can emerge, as was the extreme case in September 2019.
We are reasonably confident that the Federal Reserve’s balance sheet would still provide ample reserves for the banking system through 2024 in our baseline runoff scenario. We estimate our baseline scenario would put bank reserves at roughly $2.5-$3.0 trillion (Figure 8).2 This would put reserves roughly 65% above pre-pandemic levels and should still provide enough cushion even after accounting for the projected growth in the economy and bank assets over that time period.
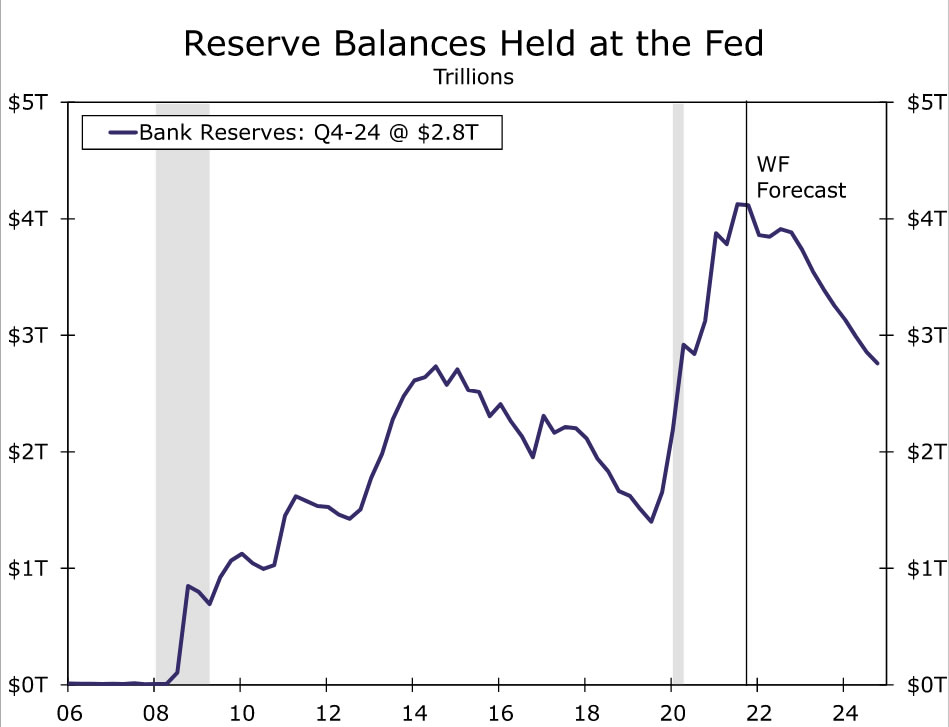
Past 2024, however, the outlook for additional balance sheet reduction is murky. Running off another $500-$750 billion in assets would push reserves much closer to their pre-pandemic level of roughly $1.7 trillion. Perhaps the Fed’s new standing repo facility, which was established in July 2021 and permits banks to borrow reserves and collateralize the loan with Treasury securities, will encourage banks to hold more Treasuries and fewer reserves than was the case the last time the Fed’s balance sheet was shrinking. That said, the facility is new and remains largely untested in times of stress, and questions remain about its ultimate effectiveness at backstopping money markets.
Of course, much can happen between now and 2024, and it is very possible balance sheet runoff will end well before then, either because the Fed wishes to stop tightening monetary policy or because of signs that reserves are starting to become scarce. For now, we think the Fed will start balance sheet runoff and, much like last time, feel its way through the dark for the “right” size of the balance sheet.
Interest Rate Implications: Higher Long-Term Yields, but Only So Much
If the Federal Reserve reduces its balance sheet by a couple trillion dollars over 2023 and 2024, this should contribute to the upward creep in yields on longer-dated Treasury securities and mortgage rates that we forecast in coming quarters. Estimating the projected impact is tricky, and even the FOMC stated in the minutes from its most recent meeting that “there is less uncertainty about the effects of changes in the federal funds rate on the economy than about the effects of changes in the Federal Reserve’s balance sheet.” That said, we are skeptical balance sheet reductions along these lines would cause long-term interest rates to jump sharply. For one, the Fed’s balance sheet remains quite large at slightly less than $7 trillion in year-end 2024. The move by the Federal Reserve to an ample reserve regime likely have made the days of a much smaller balance sheet a distant memory.
Notably, the rapid shift in expectations for the start of Fed balance sheet reductions does not appear to have had a huge impact on Treasury yields thus far. As recently as early December the median respondent in the Fed’s primary dealer survey did not expect balance sheet reductions to start until Q3-2023. Yet even as forecasts for balance sheet runoff and the first rate hike from the Fed have been pulled forward, the 10-year Treasury yield is “only” up about 27 basis points since the December 15 FOMC meeting.
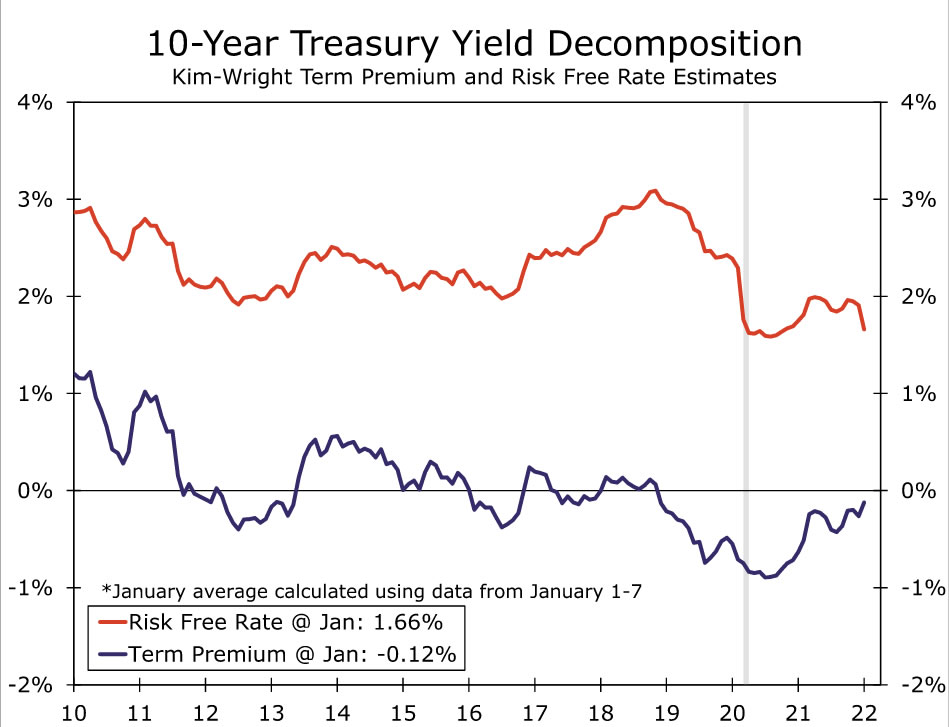
Looking back at history, the 2017-2019 balance sheet reductions do not appear to have had a major impact on yields. Analysis published by Federal Reserve researchers suggested that the numerous rounds of asset purchases done during and after the 2008-2009 recession had reduced the 10-year Treasury yield term premium by about 100 basis points.3 Yet between March 2017 and March 2019 most estimates of the 10-year Treasury yield term premium did not show much of an increase (Figure 9). The move higher in 10-year Treasury yields over that period appears to have been driven more by rate hike expectations than balance sheet runoff, and perhaps unsurprisingly the Treasury curve flattened over most of these two years.
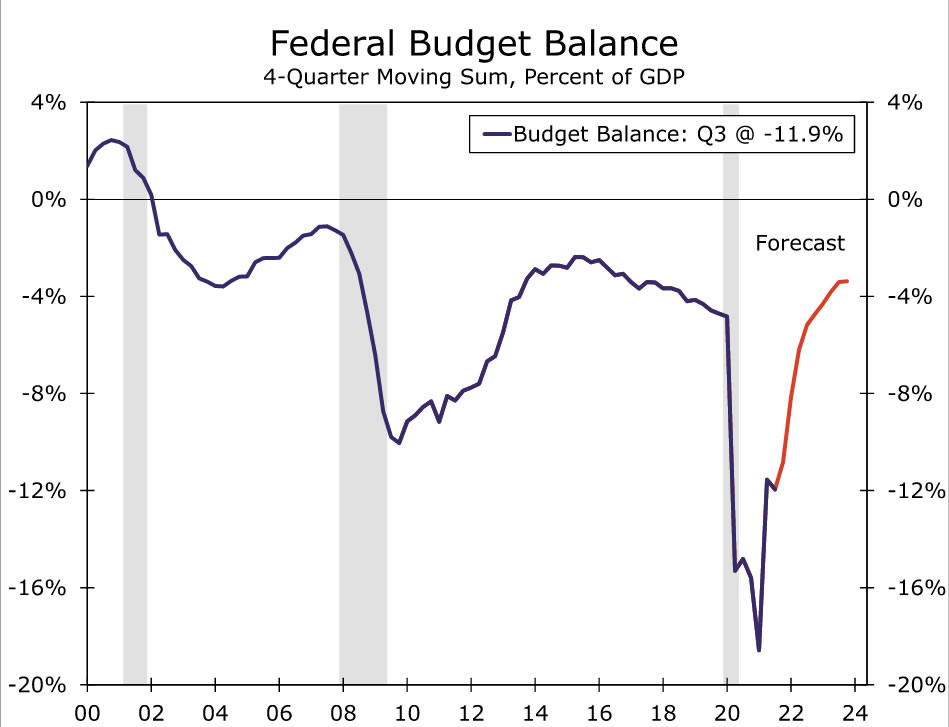
Of course, the Fed’s balance sheet runoff ended earlier than expected, and other factors may have offset the upward pressure on the term premium from the Fed’s balance sheet runoff. Indeed, the backdrop was a bit different in 2018-2019 as the European Central Bank and Bank of Japan were engaged in more robust asset purchases than we believe will be the case this time around in 2023 and 2024. But other factors have changed too, such as the direction of the federal budget deficit. In 2018 and 2019 the federal budget deficit was widening amid the 2017 Tax Cuts and Jobs Act and a material increase in discretionary spending. Our current forecast looks for the federal budget deficit to shrink dramatically over the next couple of years (Figure 10), and accordingly the U.S. Treasury is currently in the process of reducing the size of regularly scheduled debt auctions for longer-dated Treasury securities.
Ultimately the impact on Treasury yields from projected Fed balance sheet runoff is highly uncertain, much more uncertain than the pass-through from projected fed funds rate increases. We think the most likely outcome is for upward pressure on long-term Treasury yields, but only moderately so. The structural downward pressure on real long-term interest rates from demographic changes, lower potential GDP growth and elevated global savings remains intense. These factors are reflected in our 2023 year-end forecast for the 10-year Treasury yield of 2.35%.
Endnotes
1 For further reading on what happened in September 2019, see our previously published report “Repo Running Wild: A Deeper Dive“. (Return)
2 This projection assumes trend-like growth in non-reserve liabilities, such as currency in circulation and the Treasury general account. This projection also assumes that the Fed’s reverse repo liabilities return to more “normal” levels of $400-500 billion by year-end 2024. (Return)
3 Brian Bonis, Jane Ihrig and Min Wei. “The Effect of the Federal Reserve’s Securities Holdings on Longer-term Interest Rates“. April 2017. (Return)


