
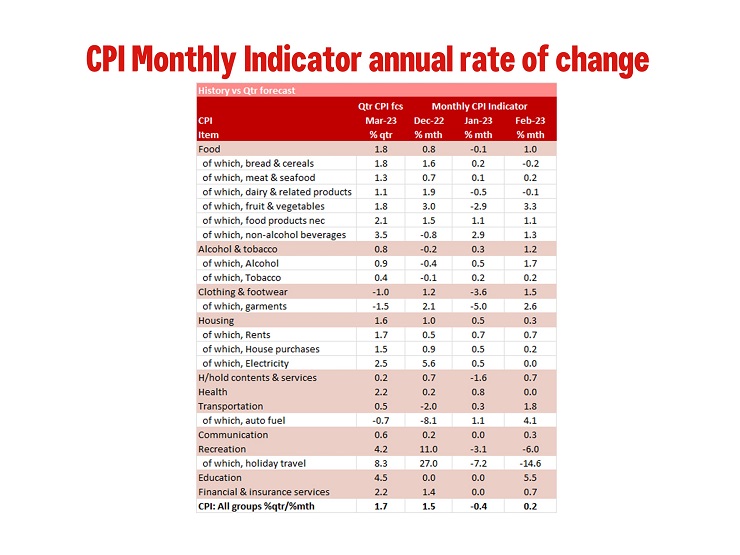
The Monthly CPI Indicator rose 6.8% in the year to February compared to Westpac’s 7.4%yr forecast and the market’s 7.2%yr. This represents a meaningful downside risk to our March CPI forecast of 1.5%qtr.
In finer detail the index rose just 0.2% in February compared to our 0.8% forecast; we assume the market median would have been around 0.6% given the 7.2%yr forecast. Compared to the average monthly increase of 0.9%mth through the last three months of 2022 the first two prints of 2023 represent a meaningful moderation in the inflationary pace; -0.4% in January and 0.2% in February.
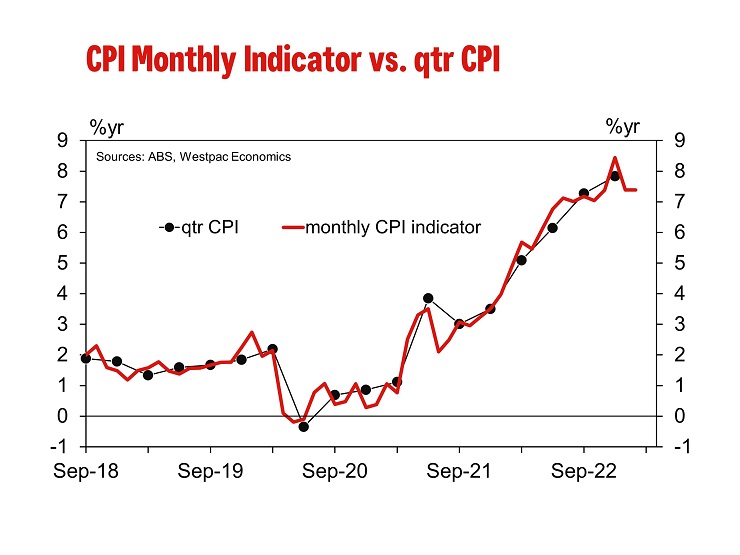
The Monthly CPI Indicator can be very volatile month to month as it is not a true monthly index but rather the released of data from the quarterly CPI as it becomes available. This volatility is due to the timing of the various price surveys. This may be why the ABS references the annual pace of growth and not the monthly change.
Combined the January and February Monthly Indicators represent a significant downside risk to our current forecast for 1.5%qtr increase in the March quarter CPI. To achieve that forecast the Monthly CPI Indicator would need to increase by around 1.5% to 1.6% in March.
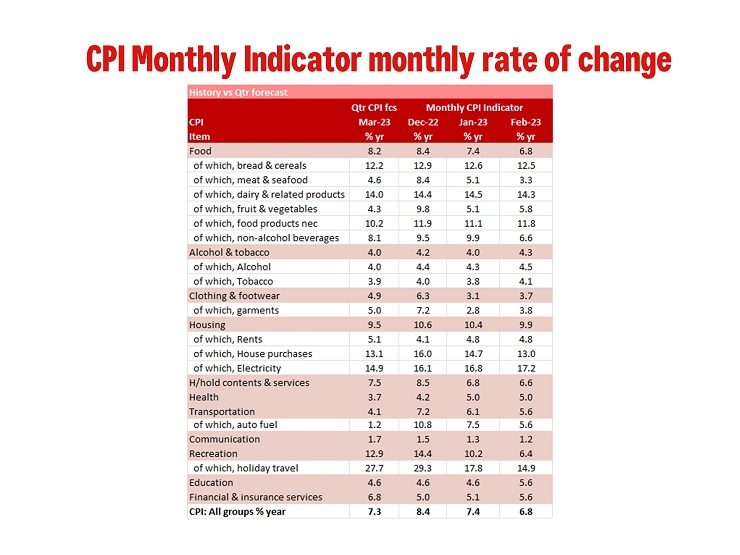
The most significant contributions to the annual rise in February: housing (9.9%yr), food & non-alcoholic beverages (8.0%yr), transport (5.6%yr) and recreation & culture (6.4%yr).
The ABS noted that the annual increase for the housing group in February (+9.9) was lower than January (10.4%). New dwellings grew 13.0%yr to February which is the slowest annual growth since February 2022 as price inflation for building materials continue to ease along with a the moderation in demand. Rents rose again due to the tight rental market, maintaining a 4.8%yr pace.
In the month housing costs lifted 0.3% on the back of a 0.7% gain in rents, 0.2% gain in new dwellings and flat electricity prices. The ABS is continuing to improve the monthly CPI indicator and each month it seems to add a new series. In February it was electricity with this series showing electricity prices up 17.2%yr. The ABS notes that the full impact of annual price reviews in July 2022 took time to flow through to many households as electricity rebates reduced electricity bills in WA, ACT, Qld and Tasmania between July and December last year.
Automotive fuel prices rose 5.6%yr, down from January’s 7.5%yr. While fuel prices drove the increase in transport, annual inflation for fuel is the lowest it has been in two years. In the month transport prices increased 1.8% while fuel prices lifted 4.1%.
The largest downside surprise for us was the 14.6% fall in holiday travel in February. We had been looking for a 6.0% fall in the month. This doubled the size of the fall in recreation & culture from our forecast 3.1%mth decline to -6.0%. While we do expect something of a reversal in March history tells us we should not expect it to make up for the 9% fall in recreation & culture in the first two months of 2023.
We are processing the Monthly CPI Indicator data to incorporate it into a complete Q1 CPI preview. Our current published inflation forecast for Q1 are 1.5%qtr/7.2%yr for the CPI and 1.3%qtr/6.6%yr for the Trimmed Mean. For now, we can state the January and February Monthly CPI Indicator results presents a meaningful downside risk to that forecast.


