
Week beginning 23 October 2017
- Inflation – an inconvenient truth.
- RBA: Deputy Governor speaking.
- Australia: Q3 CPI, trade prices.
- NZ: trade balance.
- China: property prices.
- Euro Area: ECB policy decision.
- US: Q3 GDP 1st estimate.
- Canada: BoC policy decision.
- Key economic & financial forecasts.
Information contained in this report was current as at 20 October 2017.
Inflation – An Inconvenient Truth
The key economic event next week will be the release of the September quarter Consumer Price Index.
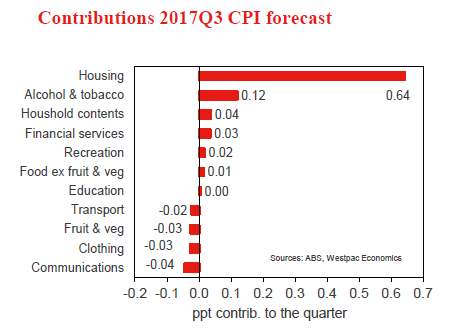
Westpac’s forecasts are: 0.74% for headline; 0.27% for Trimmed Mean; and 0.32% for weighted median.
The jump in the headline is largely driven by sharply rising electricity prices. They are expected to increase by 18% in Sydney; 5% in Melbourne; 12% in Brisbane; 10% in Perth and 20% in Adelaide. The more modest increase in Melbourne is due to the increases being spread over the September and March quarters while Perth is not on the national grid. In the other states energy prices are generally adjusted in the September quarter.
The direct impact of the rise in electricity prices adds 0.47 percentage points to the headline inflation measure.
Of course, policy is impacted by the movements in the underlying measures: the Trimmed Mean and the Weighted Median.
Our estimates indicate that momentum in these core measures is slowing. The six month annualised rate would slow from 2.1% three months ago to 1.7%. Underlying inflation for the first 9 months of the year would be printing 1.3%, making it likely that the actual result will settle below the mid-point of the Reserve Bank’s forecast range of 1.5%-2.5% (already 0.5% below the midpoint of the target range).
Key assumptions behind our forecasts include the expectation that margins in food retailing; clothing and footwear; household goods; and recreation will remain under pressure. Health costs are expected to continue to fall while the softening in the Sydney and Melbourne housing markets is likely to take some pressure off housing construction costs (usually the largest component of the Trimmed Mean).
We also note that in the minutes of the October meeting of the Reserve Bank Board it was noted that "liaison with businesses had suggested that a number of firms, particularly in the retail and manufacturing sectors, were largely absorbing increases in energy costs into margins rather than passing them through to final prices."
The surprise 0.6% fall in nominal retail sales in August and the downward revision to the July number (0% to -0.2%) also point to subdued price pressures in the retail sector in the September quarter.
The other issue challenging the outlook for inflation is the expected revisions to the weights to be used in the Consumer Price Index. The revised weights (reviewed every 6 years) are aimed at a more accurate mix of the expenditure patterns of consumers. The net impact is typically negative since consumer spending tends to rise for items where relative prices have declined and vice versa. The Australian Bureau of Statistics estimates that previous changes in weights have lowered the CPI by around 0.2 percentage points.
Our preliminary estimates point to a reduction in the measure of the CPI of a little more than this benchmark with the headline rate being reduced by up to 0.4% and the underlying by 0.3%.
So, if momentum in underlying inflation is slowing into 2018 and there is a technical need to lower the forecasts then the Bank will face a challenge in credibly maintaining its 1.5-2.5% forecast for underlying inflation in 2018 and its 2-3% forecast for underlying inflation for 2019.
Recall the last time the Bank was confronted with the need to significantly revise inflation forecasts. In April 2016 the Bank was expecting an underlying CPI print of around 0.6% and the result was 0.2%. Internally, the Bank lowered its underlying forecast from 2.5% (2-3%) to 1.5% (1-2%). It cut rates in May by 0.25%. That move was followed by another cut of 0.25% in August.
The result of that "pure" response to the inflation shock was to reignite house prices. Macroprudential policies, largely targeting investors, and a rate hike from the banks successfully deflated the booming housing market in 2015. House price inflation in Sydney slowed from 25% (6 month annualised) to -4.4% (April 2016). In response to the subsequent rate cuts house price inflation in Sydney lifted to 22.4% (January 2017). The recent "second round" of macroprudential policies has since slowed house price inflation in Sydney to 1.7% in September 2017. Comparable but less volatile trends were apparent in Melbourne.
This would be a definitive lesson for the new Governor that rigid adherence to an inflation targeting policy is likely to create disturbances in asset markets if inflation is structurally slowing.
We have seen central banks offshore take a similar approach by tending to look through the immediate data on inflation and pitch policy towards a medium term view (although the Bank of England seems poised to make a policy mistake). This is why we are confident that the FED will raise rates in December despite core PCE running at 1.4%.
Chair Yellen continues to voice confidence in the medium term "achievability" of the 2% target, with a particular aim of holding up inflationary expectations.
The FED also has a more difficult task in balancing risks around asset markets than we have in Australia.
Consider the cumulative increases in the various national house price indices since 2010.
Case-Shiller (US): 35%; CoreLogic (Australia) 43%; CREA (Canada): 68%.
Australia has an effective macroprudential policy approach for dealing with housing markets. Four banks control around 90% of the housing assets and there is a central regulator (APRA). In the US, the housing market is much less concentrated with the unregulated sectors also playing a significant role.
The policy mix which the RBA has enunciated of targeting asset markets with macroprudential and growth/inflation with interest rates is, arguably, unavailable to the FED and policy needs to be set with an "eye" on asset markets.
That does not mean that the RBA would risk financial stability in the light of a stubbornly low inflation print but it does mean that raising rates while growth and inflation underperform is also not an attractive or necessary option.
Recall that in the October minutes, the RBA Board specifically noted that moves towards higher interest rates in other economies did not have "mechanical implications" for the setting of policy in Australia. The timing of any changes in interest rates would be dependent on developments in domestic economic conditions.
So, in conclusion, there is a significant risk that inflation falls short of the RBA’s current forecasts in 2018 and 2019. However, financial stability risks preclude cutting rates. On the other hand raising rates in such an environment seems equally unnecessary while effective macroprudential tools are available to deal with unwelcome developments in asset markets.
The Week that Was
The past week has been significant because of the events that occurred more so than the data.
From the October RBA minutes, the most significant point was arguably the Board emphasising its independence from policy setting abroad. Notably, "Members observed that moves towards higher interest rates in other economies were a welcome development but did not have mechanical implications" for Australia. Further, as outlined by Deputy Governor Debelle previously, policy in Australia is not ‘extraordinarily’ easy. Hence, the RBA has time on its side and scope to act in either direction, as befits the outturn. Our view on the economy remains more pessimistic than the RBA. The key differences being their expectation for: strengthening wages and consumption growth; and broadly neutral residential investment. On both fronts, we expect growth in 2018 to disappoint, leaving GDP growth below trend.
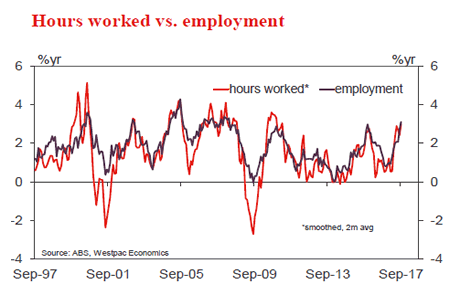
The September labour force release continued to show robust momentum in employment. See the chart of the week box below for further detail.
Last for Australia, we have released our preview of next Wednesday’s September quarter CPI. This is set to be a very interesting reading for inflation. Our headline forecast of 0.74%, if annualised, would see inflation at the top of the RBA’s target band. Yet, 0.47ppts of this outcome will come from the known jump in electricity prices – Sydney prices up 18%, the other capitals between 5% and 20%. Headline inflation (ex energy) and core inflation are both forecast to rise 0.3%, 1.2% annualised. For core inflation, the annual pace will be a benign 1.8%yr, while the six-month annualised pace will slow from 2.1%yr to 1.7%yr. Continued competition in the retail space and soft rent inflation are key trends for core inflation.
Across in New Zealand, a new government has been formed. Labour and New Zealand First have formed a minority coalition Government, with the support of the Greens. See over the page for further discussion.
Turning to China, this week saw the 19th National Congress commence. To date, communication from party officials has focused on the nation’s continued development and pursuit of higher living standards as well as their growing geopolitical power. On both fronts the belt and road initiatives of President Xi are key. Also worthy of note was the expansion of the remit of the anti-corruption unit to include government departments and SOEs as well as the party. Here President Xi showing his power as head of the party and the party’s position of leadership and authority over the nation.
On the data front, the Q3 GDP and credit data emphasised the position of strength that the nation finds itself in. GDP growth was in line with expectations at 6.8%yr in Q3, but well ahead of the authorities’ prior 2017 forecast of "around 6.5%". Notably this has come as the public sector pulled back their support for the economy, and also tightened regulation in the financial sector. The latter has not limited credit growth, which has been sustained at an elevated level through 2017. But it has resulted in a reduced share for the shadow banking system over the past six months.
As noted by PBOC Governor Zhou this week, corporate debt is "very high" and household leverage is growing quickly. The point is not to stop credit growth, but rather to improve its quality and inform the agents involved of the risks. Across the economy, there is clear evidence that investment is slowing; further, from the PMI surveys, employment growth has underwhelmed. The consequence is that GDP growth will slow more materially in Q4 and 2018. Growth of around 6.2% is expected in 2018.
Turning to the US, there is little to report from the data and news flow other than some reports that Jerome Powell is firming as President Trump’s pick for the next FOMC Chair. Being more moderate than Taylor and Warsh and having experience with the Federal Reserve as well as markets are key positives.
Northern Exposure takes a long-term perspective this week, highlighting the marked improvement in US household debt to income (a structural tailwind for discretionary spending), but in contrast a material increase in corporate leverage in pursuit of a higher return on equity. That the funds have been used for leveraging the balance sheet more so than capacity expansion restricts productive capacity and income generation for the nation – particularly if the deductibility of interest expenses is removed by President Trump.
The Redbook is also due for release this afternoon, highlighting all the key trends for the consumer and sentiment.
Chart of the Week: Australian employment growth
The September labour force release continued to show robust momentum in employment. The 20k headline gain combined with the dip in the unemployment rate to 5.5% was an unquestionably strong update. This is particularly the case given it is the 12th consecutive positive reading for employment – the strongest run of outcomes since 1994. The leading indicators we track for employment suggest that annual employment growth will largely be sustained into year end. However, to our mind the bigger question is the degree of spare capacity that remains in the economy and the industry mix for employment.
On underemployment, the latest data point we have is for August. At 8.6%, it is little changed from a year ago despite 3% jobs growth. On the mix of employment, a piece in the latest edition of Market Outlook highlights that job gains have been heavily concentrated in health, education and construction. With the latter sector to slow, this mix of job creation combined with still significant slack will keep a lid on wage gains and thus on household demand.
New Zealand: Week ahead & Data Wrap
After nearly a month of negotiations, New Zealand finally knows the form of the next Government: New Zealand First will support the Labour Party to form a minority coalition government. The Green Party will support the new government on confidence and supply.
No policy positions have been formally announced yet. However, comments by the various party leaders have highlighted some key areas where we are likely to see changes. These are discussed below.
Policy details so far suggest some downside risk to our GDP forecast for 2018 and upside risk to our GDP forecasts for 2019 and 2020, but this could change as new information comes to light. Labour’s planned fiscal stimulus, on its own, could add around 20bps to the RBNZ’s longer term forecast for the OCR, although other as yet unannounced policy changes will also have an effect.
Housing, taxation and investment
How the tax treatment of property changes under the new Government is crucial to the outlook – not only for house prices themselves, but also for the economic cycle and the long-run health of the economy.
Labour has said that they plan to convene a tax working group that might recommend some variation on a capital gains tax, land tax or deemed rate of return tax on property excluding the family home. We have long argued that such tax changes would help address some of New Zealand’s economic imbalances and housing affordability issues. Such changes could have a material negative affect on house prices, but it is far from certain that the coalition government will go ahead with Labour’s plan. The Greens are probably in support, but New Zealand First said before the election that ruling out a capital gains tax would be a bottom line in any coalition negotiation.
Labour has also signalled that it would like to introduce other changes that would affect the attractiveness of residential property as an investment (such as removing property investors’ ability to write off losses on rental properties against their personal income). If these measures do survive the coalition negotiations, they might reduce house prices by a little, but the effect would be small.
Labour planned to start an investment fund charged with building 100,000 affordable houses (and the associated infrastructure) over ten years. In our assessment, this would have only a small effect on average house prices, although it would skew the mix of new construction towards smaller/cheaper dwellings. The investment fund would probably cause us to lift our construction forecasts, and therefore our GDP forecasts. But the effect would probably be small in the short run, because in these times of a capacity constrained construction industry some private sector activity will be squeezed out.
The one housing-related policy that has been announced by the Prime Minister elect is a ban on foreign buyers of residential property and tighter restrictions on the sale of rural land. This could have a downward impact on house prices, but based on international experience, the impact is likely to be fairly small.
Closing New Zealand off to foreign direct investment in the farm sector or business sector would be a more worrying development. The OECD has identified that New Zealand’s poor productivity performance is partly due to our isolation, and so improving connectivity to larger overseas economies would be of benefit. While lifting exports is part of that, the OECD singled out our restrictive foreign investment regime as a particular impediment to productivity growth. Restricting FDI could isolate New Zealand further.
Migration
Both Labour and NZ First campaigned on reductions in net immigration. Labour estimated that its policies would reduce net immigration by 20,000 to 30,000 people per year, focused on lower skilled arrivals and students. However, net immigration has already turned. Departures have picked up, as those came over in earlier years on temporary visas are now departing. On top of this, new arrivals have fallen. Going forward, we are already forecasting a substantial reduction in net immigration, from over 70,000 now to around 20,000 by the end of 2020. If immigration regulations were tightened, we would reduce our net immigration forecast even further. In turn, this would reduce our GDP forecast.
Fiscal policy
The new coalition looks set to spend more than the previous Government, only partly funded by extra tax. Spending will be weighted towards education and health. It will be partly funded by cancelling the income tax cuts that were legislated to take effect on April 1 and by introducing new taxes. The balance would be funded by an additional $7bn of net core Crown debt over the next four years.
If the coalition sticks roughly to Labour’s proposed fiscal policy, the changes would be fairly immaterial for ratings agencies and would not lead to significantly higher government bond rates.
Monetary Policy
Both Labour and New Zealand First campaigned on changing the focus of the Reserve Bank. In particular, New Zealand First had pushed what they termed a "Singaporean" model, requiring the RBNZ to target a favourable level of the exchange rate, rather than the inflation rate. However, in his press conference, Mr Peters said that Labour had not agreed to this model.
Nevertheless, we are likely to see some change in monetary policy on two key fronts. First is a likely broadening of the policy considerations. Labour favours a dual mandate for the Reserve Bank, with a focus on full employment as well as price stability. New Zealand First has long advocated for a greater focus on the export sector. However, in the absence of numerical targets for either unemployment or the exchange rate, requiring the RBNZ to account for these considerations is unlikely to make a significant difference to how monetary policy is run as a whole. The RBNZ already factors in such concerns when it sets policy.
Second, we’re likely to see a shift from the single decision maker model to a committee, with Labour proposing a mix of four internal and three external members. Again, this is unlikely to lead to substantially different monetary policy decisions – the RBNZ already operates an internal committee for monetary policy decisions. There has been no mention of raising or widening the existing inflation target range.
Data Previews
Aus Q3 Consumer Price Index
Oct 25 Last: 0.2%, WBC f/c: 0.7%
Mkt f/c: 0.8%, Range: 0.7% to 1.2%
- The Q2 CPI printed 0.2% compared to the market median of 0.5%. The annual rate moderated to 1.9%yr from 2.1%yr in Q1. The core measures rose as expected at 0.5%qtr highlighting just how modest the broader inflation picture is outside of housing or health. The annual pace of the average of the core measures was flat at 1.8%yr.
- Westpac is forecasting a 0.74% Q3 rise in the headline CPI of which, 0.47ppts come from energy. Ex-energy (household electricity and gas) inflation rises 0.27%.
- Core inflation is forecast to print 0.3%qtr (0.29%) holding the annual rate flat at 1.8%yr. The trimmed mean forecast is 0.27% while the weighted median forecast is 0.32%. The two quarter annualised pace of core inflation decelerates to 1.7%yr from 2.1%yr, below the RBA’s target band. For more information see the bulletin "Inflation, where art thou?".
Aus Q3 import price index
Oct 26, Last: -0.1%, WBC f/c: -2.0%
Mkt f/c: -1.8%, Range: -3.0% to 0.0%
- Import goods prices were little changed over the past year, with a Q2 result of -0.1%qtr, +0.3%yr.
- For the September quarter, goods imports likely became cheaper, declining by a forecast 2.0%qtr, as the currency strengthened.
- In Q3, the Australian dollar increased by 3.0% on a TWI basis and jumped 4¢ to US79¢, a 5% increase. Global energy prices in Q3 fell modestly, in AUD terms, down around 3%.
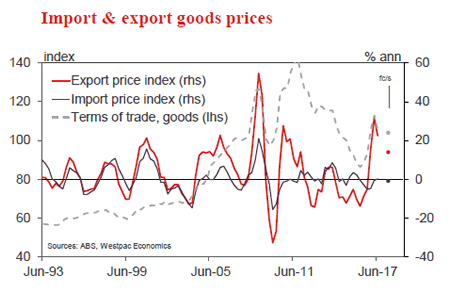
Aus Q3 export price index
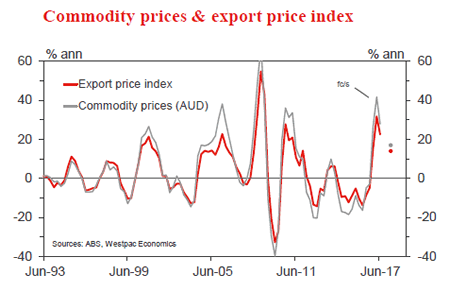
Oct 26, Last: -5.7%, WBC f/c: -3.2%
Mkt f/c: -4.0%, Range: -6.0% to 3.0%
- The sharp rebound in export prices during 2016 and into early 2017 was punctuated by a meaningful fall in the June quarter, as commodity prices eased back from recent highs.
- In Q2, the export goods price index fell by 5.7%, to still be 22.5% above the level of a year earlier.
- For Q3, export goods prices are expected to decline by around 3.2%. The RBA reports that commodity prices were flat in US dollar terms for the period and down around 5% in Aussie dollar terms.
- The terms of trade for goods, on these estimates, fell by a touch over 1% in the third quarter, to be around 11% higher than a year ago. Note, we expect this fall to be partially offset by a rise in the terms of trade for services.
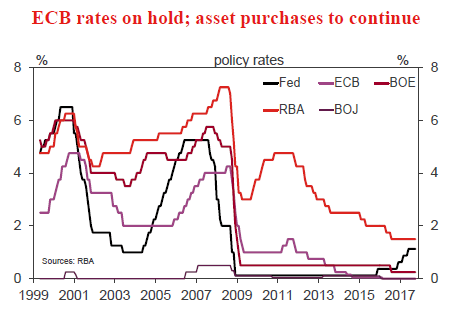
ECB October policy meeting
Oct 26, deposit rate, last -0.40%, WBC -0.40%
- All eyes remain on the ECB Governing Council as they near the end of their current asset purchase program, which is due to expire in December.
- At the October meeting, some formal announcement of an extension of the program for 2018 is anticipated. Whether all the detail is made available remains an open question.
- To our mind, the most logical program structure would be to taper from €60bn to €40bn in the first half of 2018, then to €20bn in the second six months. That would allow a smooth transition to a flat balance sheet come 2019. The alternative would be a circa €30bn pace through the entire year. Either way, some €360bn in additional liquidity would be provided to markets and the economy during 2018. Interest rates will remain unchanged in 2018 and early 2019.
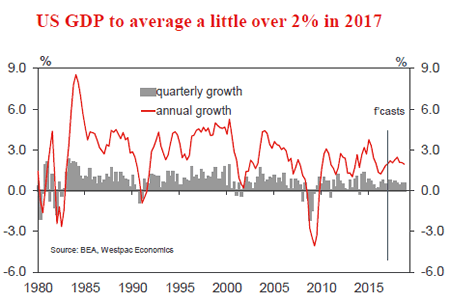
US Q3 GDP
Oct 27, last 3.1%, WBC 2.2%
- The September quarter was a tumultuous time for the US economy, owing to the arrival of Hurricanes Irma and Harvey.
- The largest impact is likely to be seen in household consumption and secondly construction. Consumption growth is expected to be quite modest, while construction’s contribution to growth, if any, will be negligible. Recent durables goods data implies equipment spending started the quarter well; so even with the storms, it should provide a solid contribution to growth in the quarter.
- Overall, we look for growth of 2.2% annualised in the quarter, down from 3.1% in Q2. A bounce back towards 3.0% is then anticipated in Q4 as restocking occurs. The posthurricane rebuild will aid growth in 2018, albeit likely only at the margin.


