
Friday provided a sharp shift in post-FOMC flows. The strong rallies in Equities—particularly in defensive sectors—turned sour as Fed members began to voice concerns regarding their recent decision.
The bounce in the Debasement Trade following the Fed meeting came as a surprise, especially given that the cut and projections were more defensive than aggressive. Indeed, making a dovish case for 2026 is proving difficult, with the recent Dot Plot indicating only 1 to 2 cuts for the coming year.
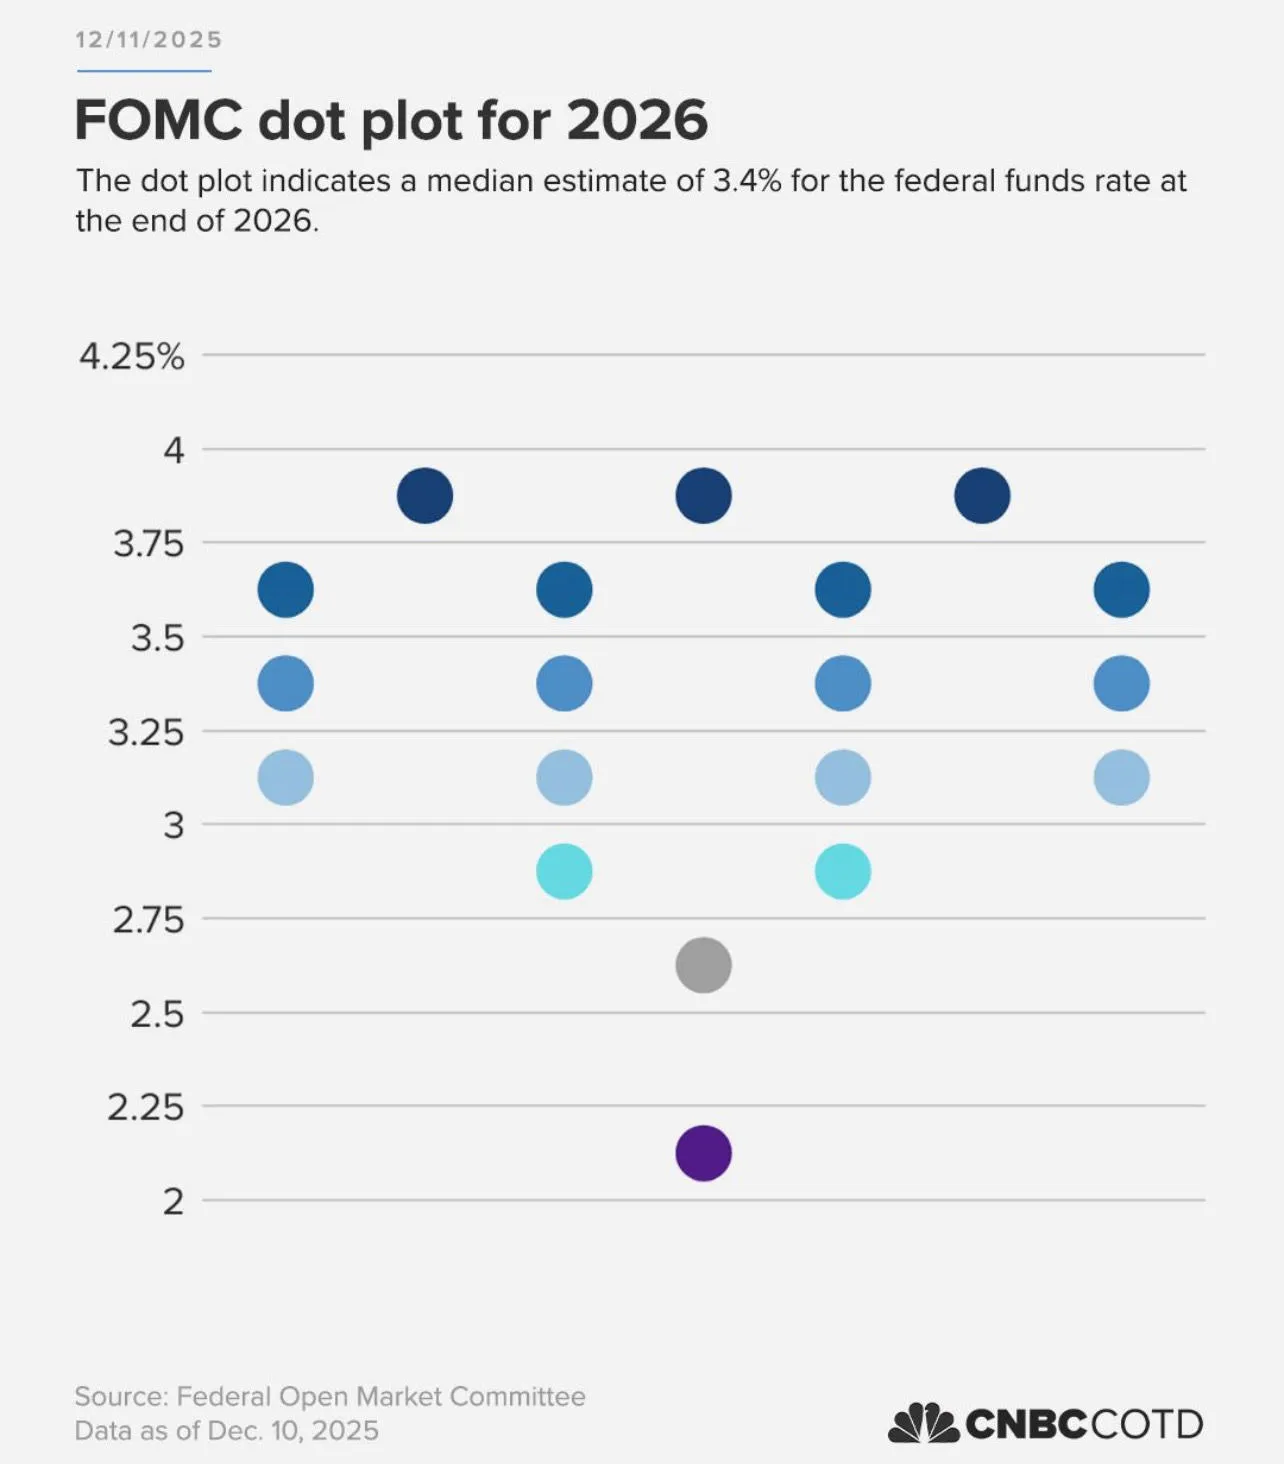
Dot Plot for 2026 – Source: CNBC
Fed’s Goolsbee, a dissenter of the recent cut (alongside Kansas Fed’s Schmid), gave markets and risk assets a fresh reality check through multiple rounds of interviews. His stance is clear:
- The Fed was and still is in a “comfortable position to wait.”
- The central bank is still blind on the inflation picture.
- Frontloading cuts now could carry significant risks.
Consequently, stocks printed a local top and have struggled to rebound since.
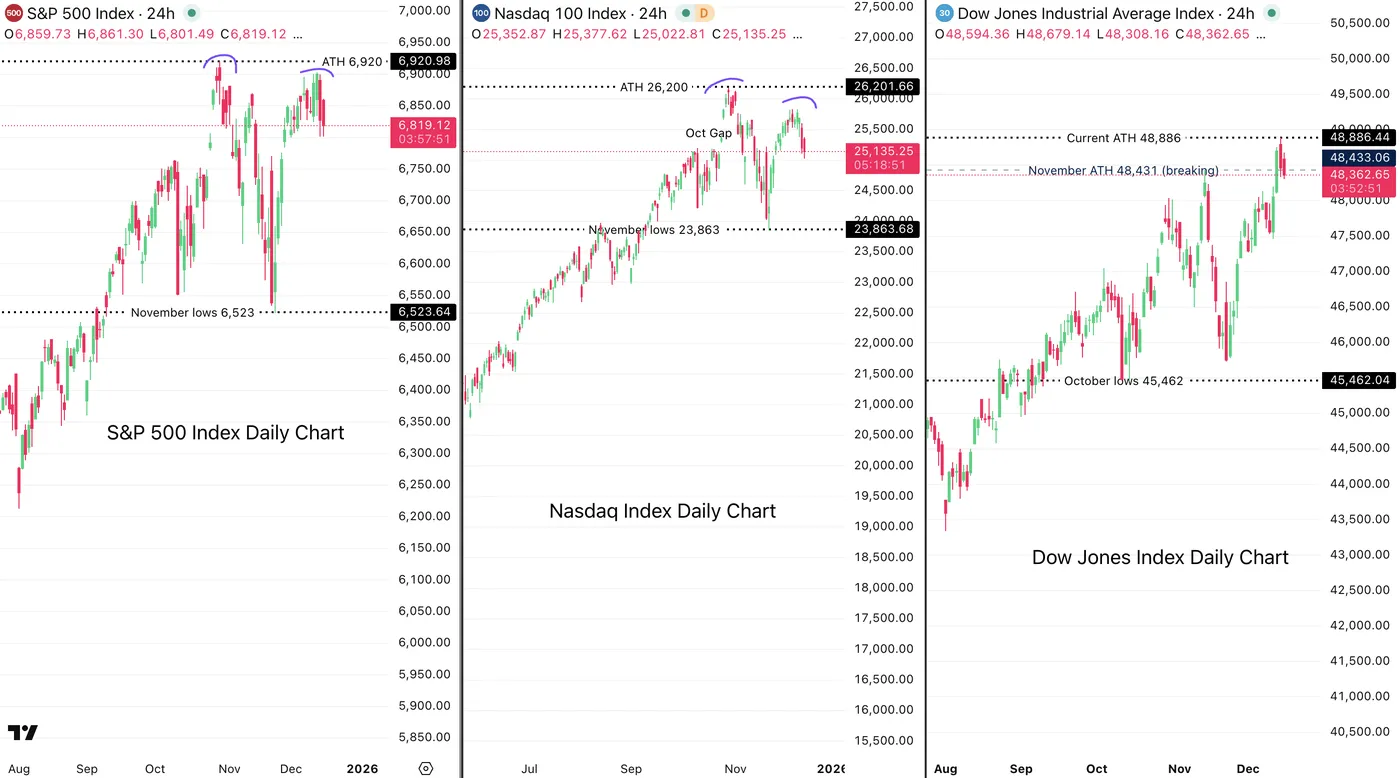
US Main Indexes Daily Outlook – Double tops in S&P 500 and Nasdaq? December 15, 2025 – Source: TradingView
NY Fed President John Williams just issued a counter-narrative, warning that the labor market poses new risks while noting that inflation has eased—effectively mirroring Goolsbee’s comments but from a different angle of concern.
But dip-buyers haven’t showed as much conviction this time around.
As markets wiggle around in this conflicting narrative, all eyes are on tomorrow’s NFP report (preview coming up soon).
Let’s dive into the intraday timeframe charts for all major US stock indexes to see where we stand.
A mixed picture across sectors – Typical pre-NFP trading
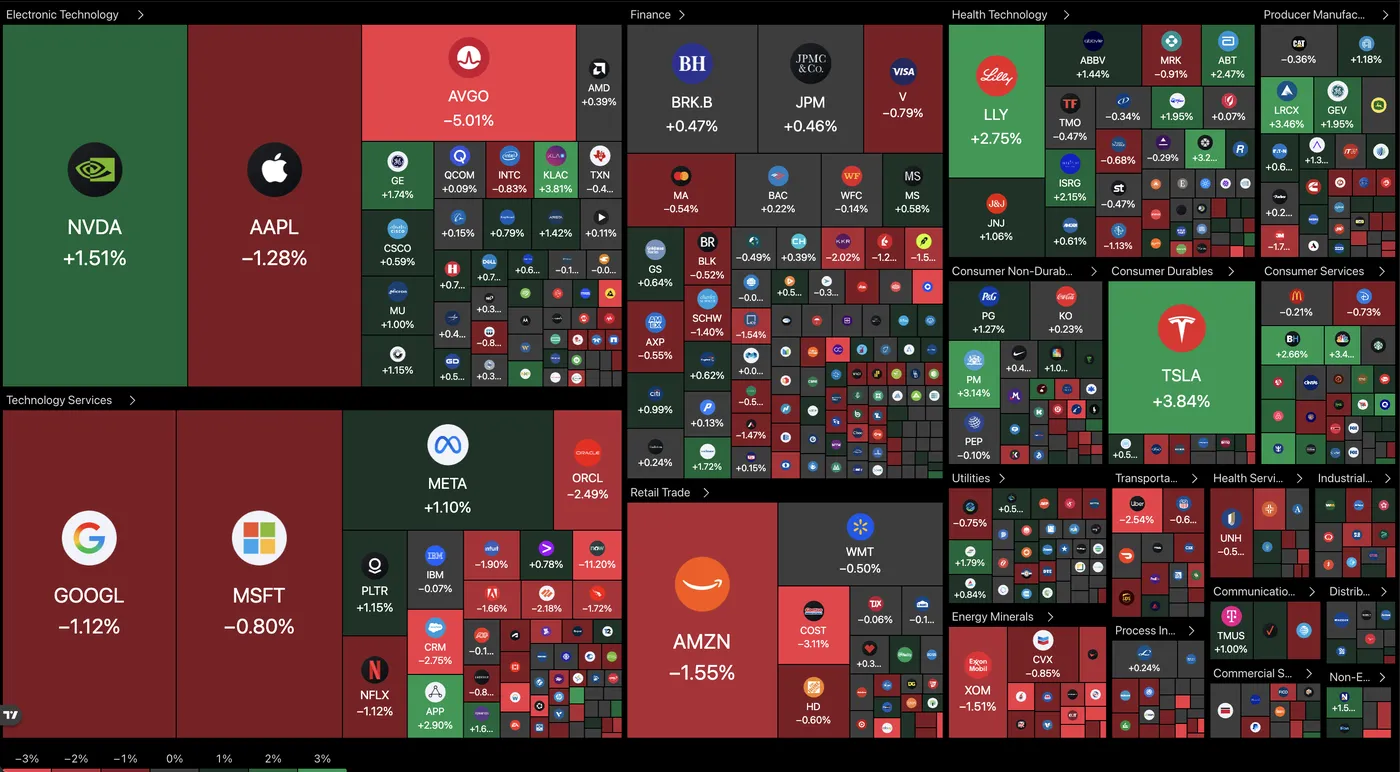
Current picture for the Stock Market (12:50 A.M. ET) – Source: TradingView – December 15, 2025
Dow Jones – Buyers are not following through
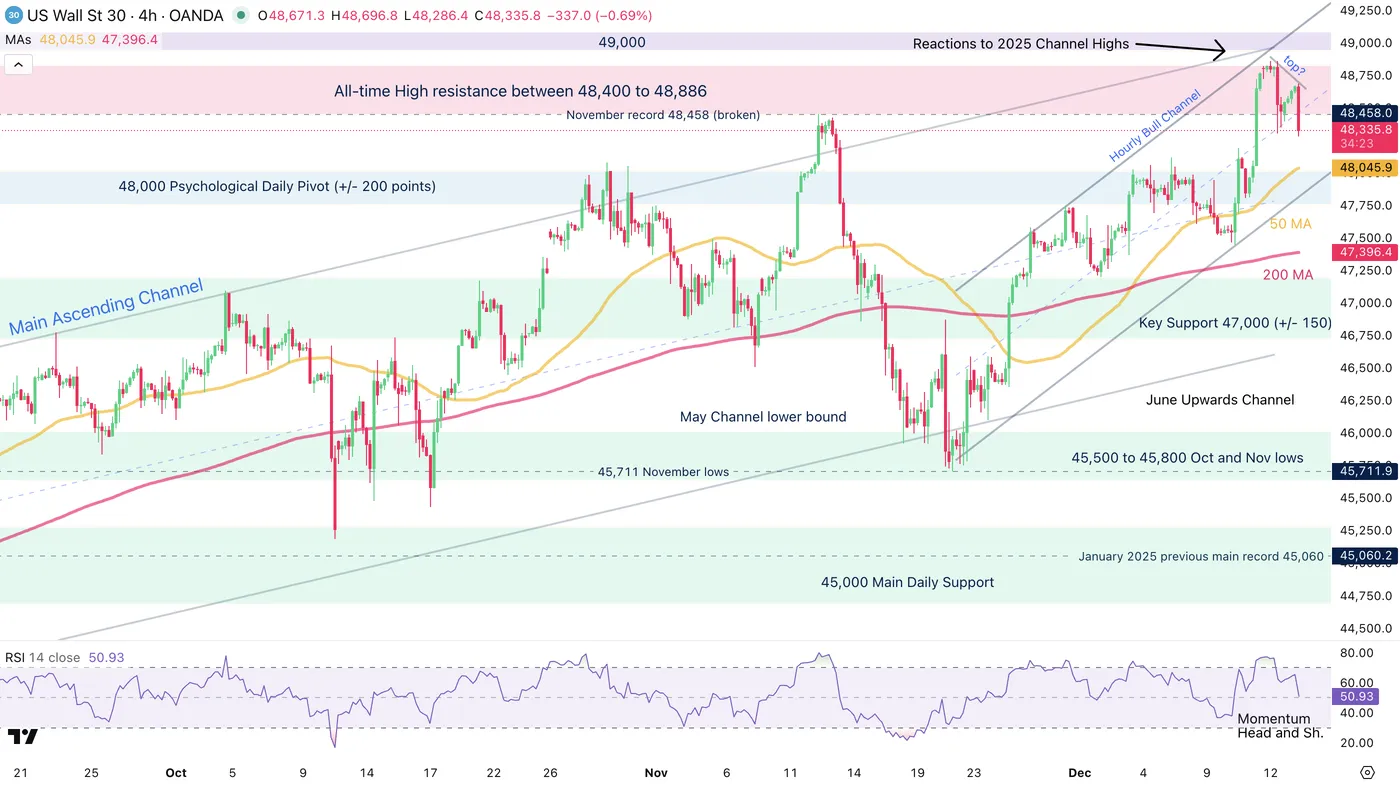
Dow Jones (CFD) 4H Chart – December 15, 2025 – Source: TradingView
The Dow Jones, bellwether of the post-FOMC bullish sentiment, has just rejected to its higher timeframe upward channel (formed since May 2025).
Still evolving within the uptrend, the indication is more one of a slowdown in buyers’ strength, for now, but things are still subject to change after tomorrow’s release.
Having formed a Head and Shoulders on its 4H RSI, momentum is facing a wall.
Sellers have held prices at the past week lows throughout the entire morning session, so look at whether buyers manage to rebound from here.
Failing to do so opens the door for sellers to take the short-term control.
The hourly bull channel has its lower bound at around 47,850. Watch the reactions when and if prices get there.
Dow Jones technical levels of interest:
Resistance Levels
- All-time High resistance between 48,400 to 48,886 (rejecting)
- 48,700 session highs
- Potential Fib Target 2 49,526
- 50,000 Psychological Level and Potential Fib Target 3 (50,159)
Support Levels
- 50-period MA at 48,000
- Short-term Channel lows 47,850
- Key Support 47,000 (+/- 150) and MA 200
- August highs and November Lows 45,715
- 45,000 psychological level (next support and main for higher timeframe)
Nasdaq – Higher timeframe warning
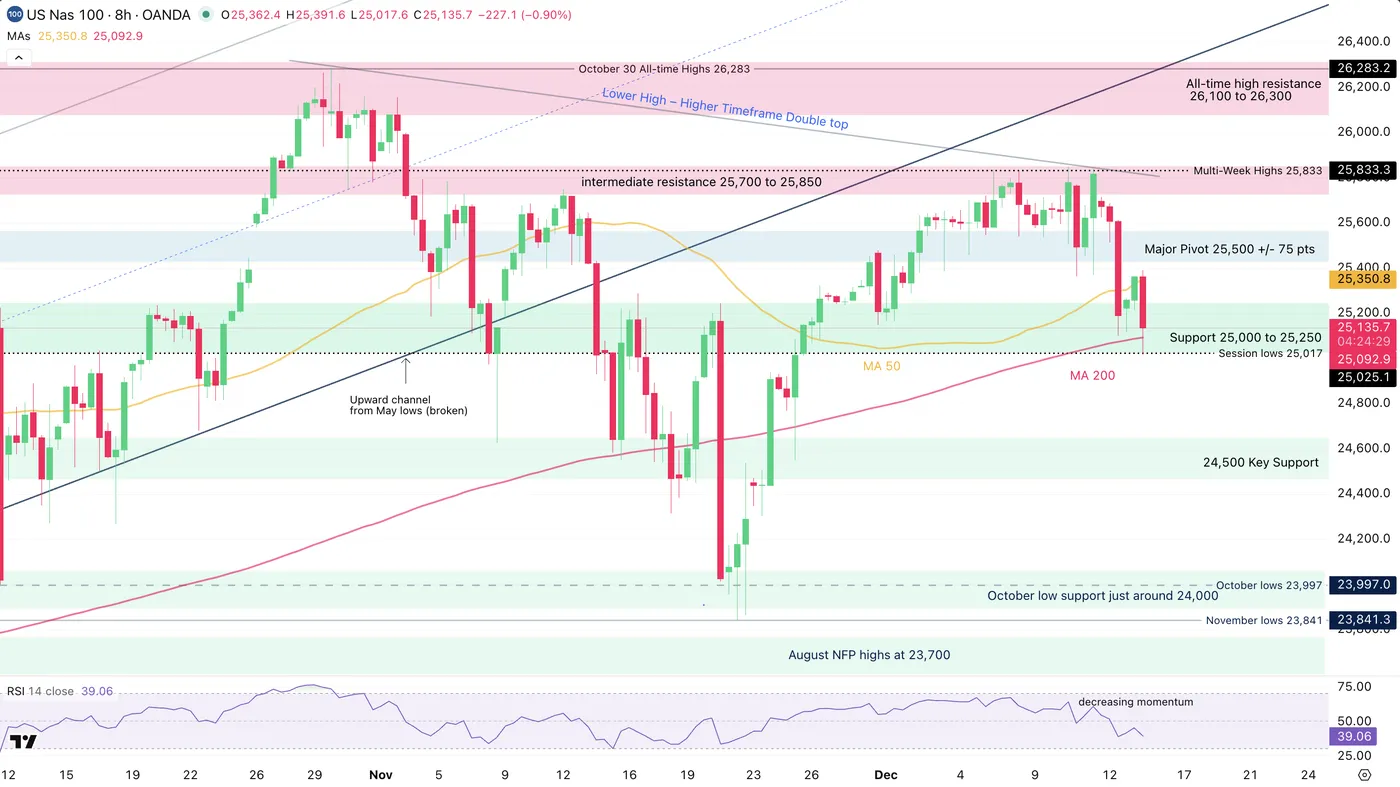
Nasdaq (CFD) 4H Chart – December 15, 2025 – Source: TradingView
Nasdaq is sending scary signs for tech and AI bulls.
After a solid rebound ahead of the FOMC, the index hasn’t been able to show any form of strength since the cut, even forming a double-top/lower high with the past week’s bullish impulse.
The 25,000 level, acting as immediate support, will be one of its decisive support, supported by the 4H MA 200 for the bulls to maintain the mid-term bullish outlook.
Nasdaq technical levels of interest:
Resistance Levels
- Major Pivot 25,500 +/- 75 pts
- intermediate resistance 25,700 to 25,850 (recent highs)
- All-time high resistance zone 26,100 to 26,300
- Current ATH 26,283 (CFD)
Support Levels
- Support 25,000 to 25,250 (current lows, testing)
- 24,500 Main support and Pivot (recent rebound)
- October and November lows just below 24,000
- Early 2025 ATH at 22,000 to 22,229 Support
S&P 500 – A fragile range
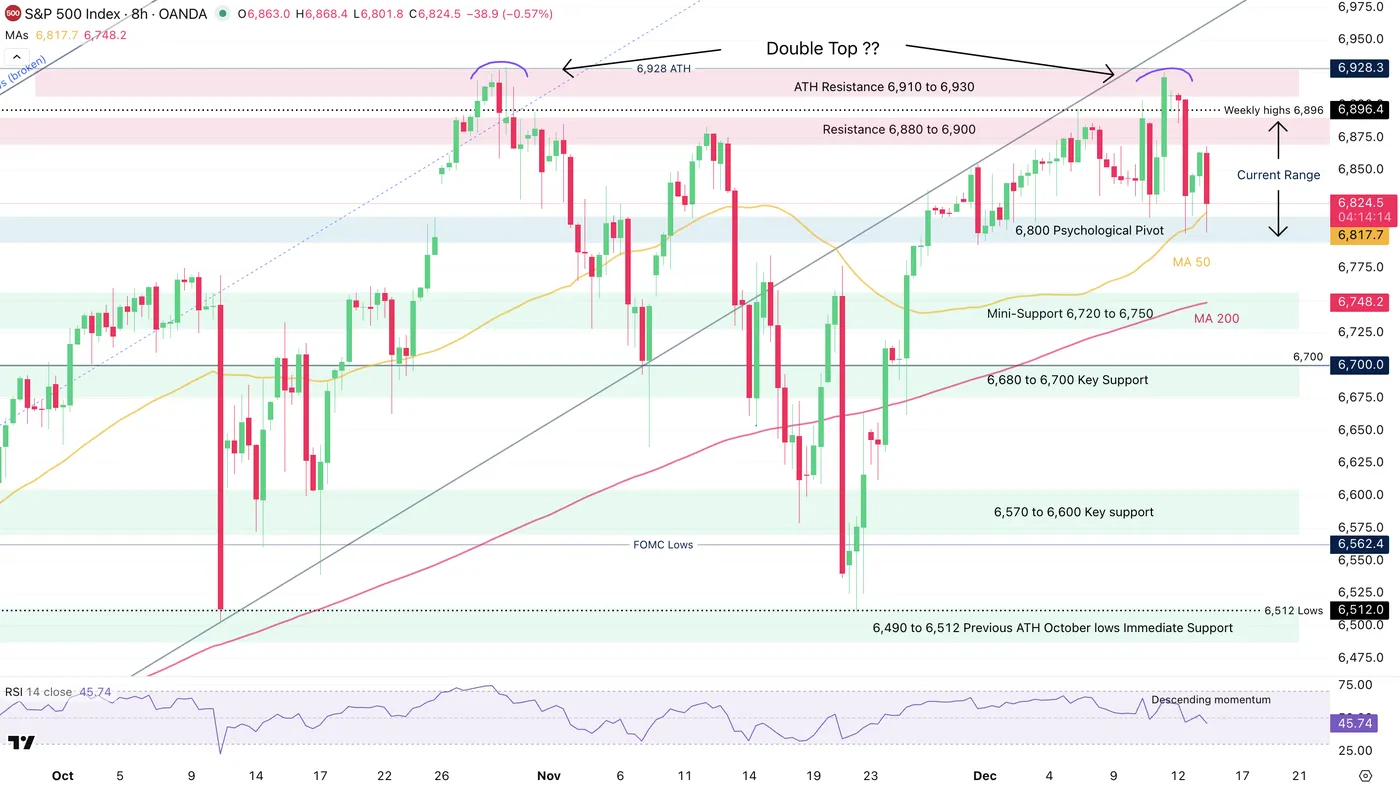
S&P 500 (CFD) 4H Chart – December 15, 2025 – Source: TradingView
The S&P is still holding the 6,800 to 6,900 range indicated in our latest Index analysis but is now testing its support.
Holding 6,800 will be key for bulls to withhold their current strength, particularly as the higher timeframe is also sending signs of a double top – however not as scary as the one in Nasdaq.
Keep a close eye on the psychological support.
- Closing above would maintain the rangebound/bullish picture.
- Closing below opens the door to some downside all the way to November lows around 6,600.
S&P 500 technical levels of interest:
Resistance Levels
- 6,930 (current All Time-Highs)
- Weekly highs 6,896
- Resistance 6,850 to 6,880 (testing)
- ATH Resistance 6,900 to 6,930
Support Levels
- 6,800 Psychological Pivot
- Support 6,720 to 6,750 and 8H MA 50
- 6,490 to 6,512 Previous ATH October lows (recent lows)
- 6,400 psychological support
Safe Trades!