
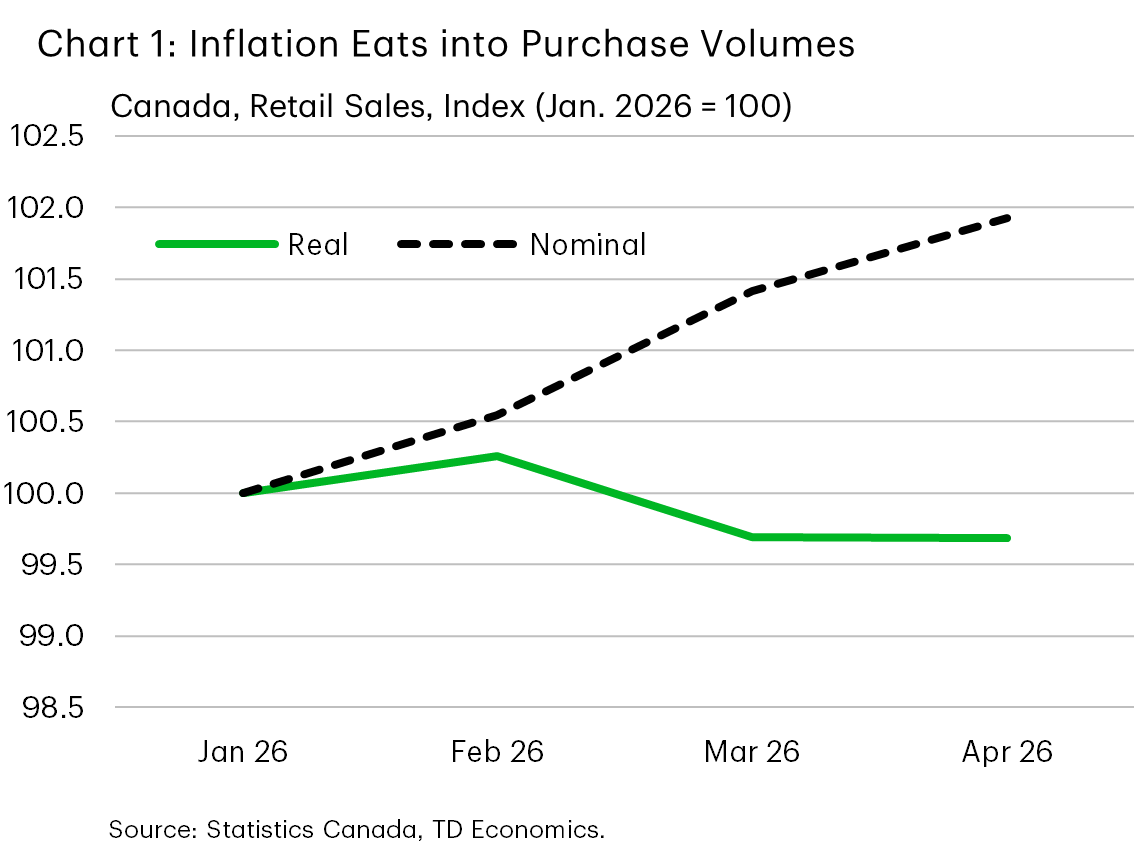
ca-chart-1-1

ActionForex.com was set up back in 2004 with the aim to provide insightful analysis to forex traders, serving the trading community for over a decade. Empowering the individual traders was, is, and will always be our motto going forward.
Contact us: contact@actionforex.com
© ActionForex.com © 2026 All rights reserved.