U.S. Review
Soaring Sentiment, but Will the Hard Data Follow?
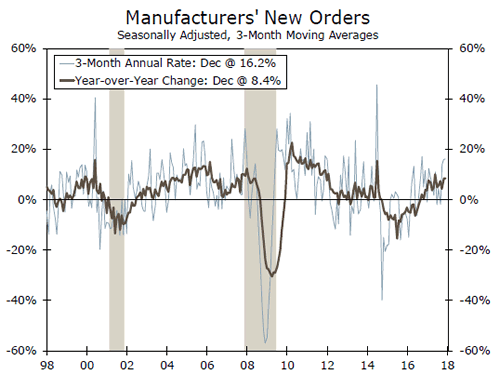
- U.S. factory sector data released this week showed another divergence between the "hard" and "soft" data. The ISM manufacturing index reached its highest level since 2004, but durable goods orders showed signs of cooling.
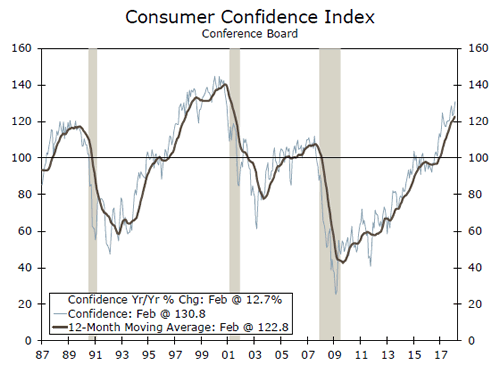
- The Consumer Confidence Index climbed to 130.8 in February, touching the highest level since late-2000 despite volatile U.S. equity markets.
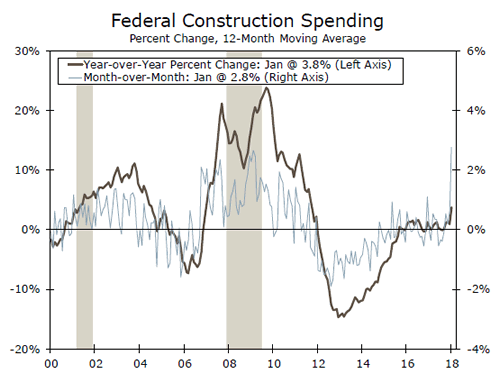
- New and pending home sales slipped in January, while strong public construction spending offset some weakness in the private sector.
Soaring Sentiment, but Will the Hard Data Follow?
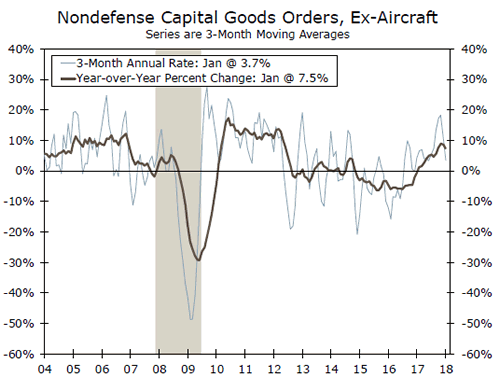
U.S. factory sector data released this week showed another divergence between the "hard" and "soft" data. On the hard data front, private equipment spending looks to be cooling after increasing at a double-digit pace in the third and fourth quarters of 2017. Durable goods orders fell 3.7 percent in January, with much of the decline concentrated in the volatile nondefense aircraft component. Our preferred gauge of future business investment, orders excluding aircraft and defense, fell 0.2 percent in January on the heels of a 0.6 percent decline in December. The trend in core capital goods orders has weakened noticeably from the impressive run in the fall; core capital goods orders are up at a 3.7 percent three-month average annualized pace, compared to over 18 percent as recently as November (see chart on page 1).
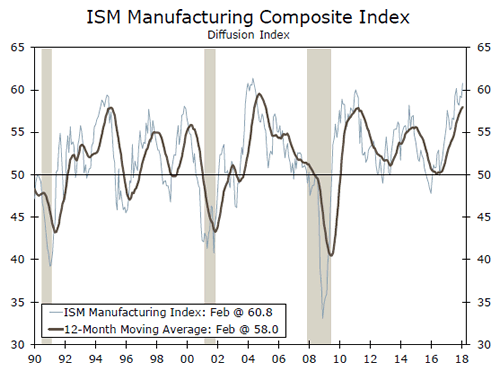
Survey data on U.S. manufacturing, however, continued to reach new heights. The headline print of 60.8 for the ISM manufacturing index was the highest since 2004 and the latest affirmation of broadening business confidence (top chart). The prices paid component of the index continued climbing—signaling building price pressures in the pipeline—and the employment component jumped to 59.7 after a sharp fall to 54.2 in January. As we have written previously, we expect to see the hard data for orders converge with the survey data. In times of such pronounced survey strength, however, the gap between hard and soft data is usually narrowed by business surveys getting reined in, rather than the hard orders data, which feed directly into GDP calculations.
Survey-data released this week also showed consumer confidence soaring. The Conference Board’s Consumer Confidence Index climbed to 130.8 in February, touching the highest level since late- 2000. Both the present situation and future expectations indices rose in the month, with more upbeat sentiment about the availability of jobs and expected income growth. February’s stock market volatility seemed to have little effect on consumer sentiment. A separate release from the Department of Commerce showed strong disposable income growth in January as the tax cuts began to take effect. Consumption growth started the year off on a bit of a soft note, but rising confidence and solid income growth bode well for consumption growth over the remainder of the year.
New home sales slipped in January, falling 7.8 percent despite market expectations for a 3.5 percent gain. The winter months can have notoriously volatile seasonal adjustment factors for home building, however, and some upward revisions going back to October helped offset some of the January weakness. Pending home sales also exhibited weakness in January. Construction outlay data were a bit better, as private residential spending rose 0.3 percent and 0.6 percent in the single-family space. Public construction in particular exhibited strength: federal outlays surged 14.9 percent in the month after a 12.7 percent jump in December (bottom chart). Q4-2017 saw the fastest growth in the government line of real GDP since Q2-2015. Although seasonality issues could be at work, this recent data is an early sign of continued near-term momentum in this sector.
U.S. Outlook
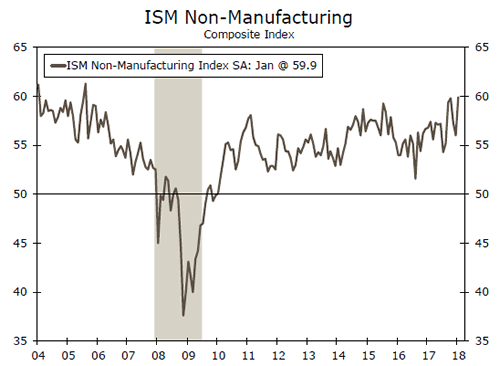
ISM Non-Manufacturing • Monday
The ISM non-manufacturing index rose 3.9 points last month to reach a new cycle high of 59.9. The index had reached a cycle high previously in the fall due to hurricane-related distortion, but this record-breaking print is being driven by overall firming in the sector. Non-manufacturing new orders rose 8.2 points in January, which was the strongest monthly increase in the series since early 2009. Prices increased in 15 of the 18 industries reported in service firms last month.
While a trend has yet to emerge, price gains will be something to keep an eye on over the first half of the year. Trade data in the index will also hold significance. Last month, export and import activity picked up, above their six-month averages. However, the rise in imports has been stronger than exports, suggesting trade could be a headwind to Q1 GDP growth.
Previous: 59.9 Wells Fargo: 58.8 Consensus: 58.7
Factory Orders • Tuesday
Factory orders closed 2017 with a 1.7 percent increase in December, marking the fifth straight monthly increase, including upwardly revised November data. Core capital goods shipments were up nearly 9 percent on the year and are up 12.1 percent on a three-month annual rate basis. Equipment spending in Q4 grew by an initially reported 11.4 percent; however, the recent strength in core capital goods, in part, reflects the upwardly revised Q4 equipment spending figure to 11.8 percent. Looking forward into Q1, core capital goods orders slipped a bit in December but are still elevated on an annualized rate basis.
There is still a disconnect between euphoric soft data with ISM new orders near record highs, and hard data that has not quite kept pace. If January’s factory orders report confirms survey data strength, Q1 business investment and equipment spending could be in for another strong quarter.
Previous: 1.7% Wells Fargo: -1.1% Consensus: -0.5% (Month-over-Month)
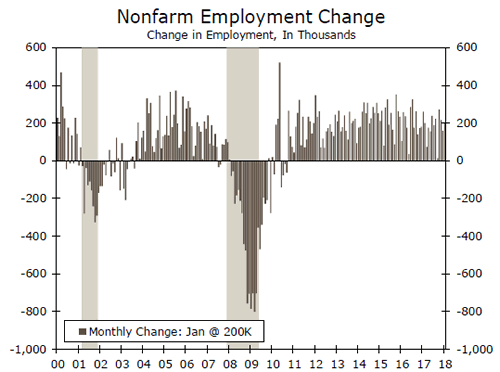
Employment • Friday
January’s jobs report posted a solid 200,000 job gain with broad strength, with 63 percent of industries adding jobs compared to just 52 percent last year. Average hourly earnings rose 0.3 percent in January and are now up 2.9 percent over the year. Earnings have trended upwards over the past six months, and this caused some concern in the markets, as higher labor costs could squeeze profits and accelerate inflation. Previously, wages had been sluggish due to low productivity and weak inflation.
Labor force participation is an area that needs improvement if we are to achieve sustained 3 percent growth, as it would help drive both productivity and income growth. The labor force participation rate has trended downwards since the turn of the century, and has remained just under 63 percent over the past two years. The unemployment rate held at 4.1 percent in January, and we expect it to continue declining as job growth outpaces labor force growth.
Previous: 200,000 Wells Fargo: 210,000 Consensus: 200,000
Global Review
Economic Recovery Continued in South America in 2017
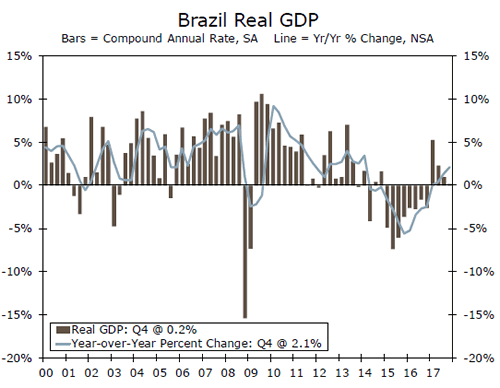
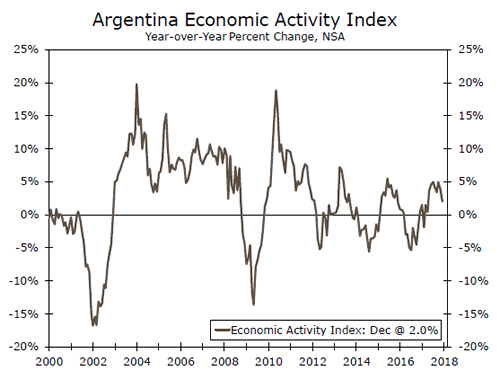
- Growth was not strong, but was in the right direction for some of the largest economies in South America. The Brazilian economy managed to grow 1.0 percent in 2017 after a 2.1 yearover- year rate in Q4-2017, with the external sector driving growth. Argentina’s economy grew 2.8 percent in 2017. China’s Manufacturing Disappointed, U.K.’s Did Not
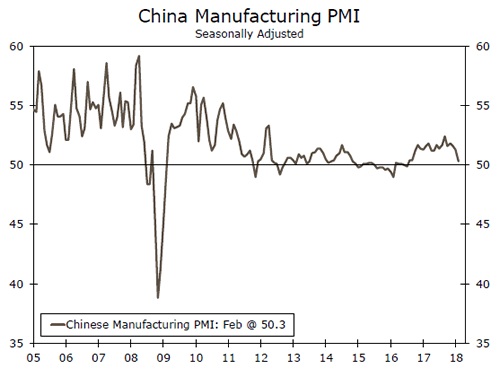
- The official manufacturing PMI for February dropped close to the demarcation point once again, to 50.3 from 51.3 in January, after remaining above 51 for more than a year.
- In the United Kingdom, the manufacturing PMI came in a bit higher than what markets were expecting, at 55.2 versus markets expectations’ of 55.0.
Economic Recovery Continued in South America in 2017
Not strong, but in the right direction, should be the call for some of the largest economies in South America. The largest one, which is also the ninth-largest economy in the world, Brazil, finally abandoned a recession that lasted more than two years. Economic growth was not great, and risks are still high for this economy in 2018, but it managed to grow 1.0 percent in 2017 after a 2.1 yearover- year rate in Q4-2017. From the Q4 release, it is clear that although domestic consumption is starting to improve, the economy was driven by the external sector. Real exports of goods and services surged 9.1 percent in the final quarter of the year, year over year, and 5.2 percent for the year as a whole, while real imports of goods and services grew 8.1 percent on a year-earlier basis in Q4-2017 and 5.0 percent for the whole of 2017. Real personal consumption expenditures were up 1.0 percent, while real government expenditures were down 0.6 percent. Growth in real gross fixed investment was negative for the whole of 2017, down 1.8 percent, but it grew 3.8 percent on a year-earlier basis in Q4-2017, clearly showing a recovering trend that will help the prospects for economic growth in 2018 if the political cycle does not add to the uncertainty over the future of the Brazilian economy.
Meanwhile, Argentina’s economy grew 2.8 percent for 2017, according to the monthly economic activity index, after declining 2.2 percent in 2016. While we do not have demand-side numbers yet, we suspect that the recovery in the global economy also contributed to the performance of the Argentine economy in 2017 as it did for the Brazilian economy. Perhaps in the Argentine case, the balance of growth was relatively more even between the external sector and the domestic economy than in the case of Brazil, as the country’s construction industry led the way from the supply side in the recovery process.
China’s Manufacturing Disappointed, U.K.’s Did Not
In China, the official manufacturing PMI for February dropped close to the demarcation point once again, to 50.3 from 51.3 in January, after remaining above 51 for more than a year. However, the Caixin China manufacturing PMI, which tends to survey foreign firms producing for the export market, saw its index improve slightly, from 51.5 in January to 51.6 in February. The difference between these two indices is probably related to the current state of the global economy versus the Chinese economy, i.e., the global economy has continued to expand, while data suggest that the domestic Chinese economy may be decelerating a bit in Q1-2018. In the United Kingdom, the manufacturing PMI came in a bit higher than what markets were expecting, at 55.2 versus markets expectations of a 55.0 reading, but the index was slightly lower than the 55.3 print recorded in January. All this information, together with the release of a strong February manufacturing PMI for the United States, continues to point to a relatively strong and steady manufacturing sector across the global economy. In some sense, this week’s numbers for the manufacturing sector are a sign that global growth has steadied over the past several quarters, which is no small feat.
Global Outlook
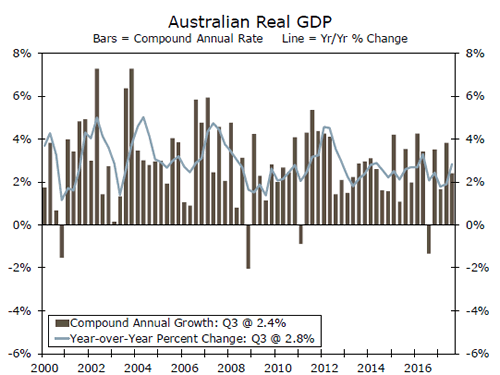
Australia GDP • Tuesday
The Australian economy expanded 2.8 percent year over year in Q3, largely driven by a pickup in investment spending and a modest build in inventories. While the business sector expanded in Q3, private consumption was weak, up just 0.1 percent sequentially. However, recent data point to an improving consumer outlook. Monthly retail sales rose on average 2.4 percent year over year in Q4, and the unemployment rate continues to trend lower. The economy is likely poised for further expansion, as consumer spending improves and a tighter labor market should put upward pressure on wages. The Reserve Bank of Australia (RBA) also meets next week on Monday. Slow wage growth, below-target inflation and high levels of household debt have kept the RBA on hold for the past several quarters. However, its latest policy statement cited improving economic conditions. In the midst of slowly increasing inflation, we look for the RBA to raise rates either later this year or in early 2019.
Previous: 2.8% Consensus: 2.5% (Year-over-Year)
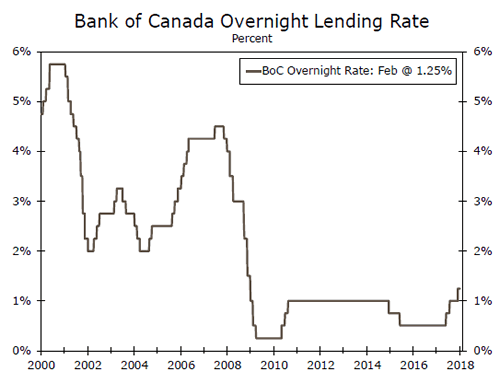
Bank of Canada Meeting • Wednesday
The Bank of Canada (BoC) hiked its overnight target lending rate 25 bps to 1.25 percent at its January meeting, largely due to a strong labor market and inflation within the target range. Although economic growth remains solid and inflation is firmly within the BoC’s target range of 1-3 percent, we look for the BoC to remain on hold until the second half of this year. The BoC has already tightened its policy rate 75 bps since July 2017, and is likely mindful of how higher rates will affect consumers. Highly-leveraged households are already facing higher mortgage rates, and other debt servicing costs could also increase. The BoC also cited ongoing NAFTA negotiations as a risk to the outlook, as the United States is Canada’s largest trading partner. On net, the outlook remains positive for future rate hikes, albeit at a gradual pace. We acknowledge some upside risk to our forecast, should growth pick up or NAFTA negotiations result in a more favorable outcome for Canada.
Previous: 1.25% Wells Fargo: 1.25% Consensus: 1.25%
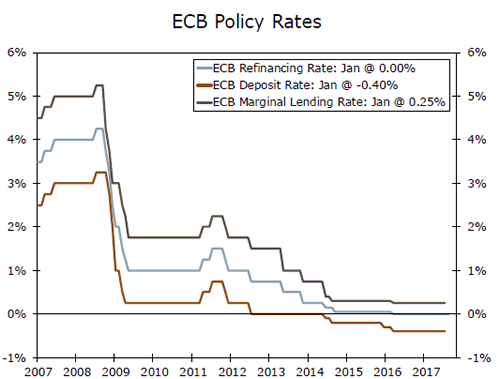
European Central Bank Meeting • Thursday
Economic growth in the Eurozone is becoming increasingly broadbased; however, sluggish inflation has restrained the European Central Bank (ECB) from implementing a more rapid pace of policy normalization. Core CPI inflation was only 1.0 percent in February, and ECB President Mario Draghi’s testimony to the European Parliament this week cited that "inflation has yet to show more convincing signs of a sustained upward adjustment." However, an overall pickup in growth—Q4 real GDP increased 2.7 percent year over year—combined with a tightening labor market, should support slowly increasing inflation in the coming quarters. While we do not expect the ECB to make any policy changes on March 8, we look for the ECB to end its current €30 billion monthly pace of bond purchases by the end of this year. We then look for the ECB to slowly begin to raise rates by first hiking the deposit rate in H1-2019, while leaving the overnight interbank rate and two-week refinancing rate unchanged for the time being.
Previous: 0.00% Wells Fargo: 0.00% Consensus: 0.00%
Point of View
Interest Rate Watch
So, Mr. Powell, How’s the New Job?
The new Chairman of the Federal Reserve, Jerome Powell, took the oath of office on February 5, the same day that U.S. stocks went into freefall and the Dow Jones Industrial Average posted it largest singleday point drop on record, falling 1,175 points.
It would certainly be unfair to blame the new Chairman for the selloff, although it certainly made for a memorable first day on the job. This week, financial markets got an opportunity to take the measure of the new Fed Chairman when he headed to Capitol Hill to meet with lawmakers for the semiannual Monetary Policy Report.
The initial financial market reaction to the published policy report was rather muted, but sparks flew on Wall Street later in the day on Tuesday when the Q&A of Mr. Powell was widely interpreted as being at least somewhat more hawkish than the carefully crafted formal report. After stating that, in his personal view, the economy had strengthened since December, Powell added that "we’ve seen continuing strength in the labor market — we’ve seen some data that in my case will add some confidence to my view that inflation is moving up to target." Equity markets sold off again on Tuesday as Treasury yields climbed higher.
Later in the week, during Powell’s appearance before the Senate Banking Committee on Thursday, financial markets had more or less stabilized… until the President announced his new tariffs on steel and aluminum. The immediate reaction was another steep sell-off in stocks. Another takeaway from the Q&A of the new Fed Chair is that he does not place too much importance on financial market volatility when considering the course for monetary policy. A week like this one feels almost designed to test anyone’s nerve.
Another interesting takeaway from Powell’s appearances this week centered on whether recent improvements in the labor market would translate into higher inflation. "For wages to go up sustainably, you need higher productivity," Powell argued. We agree. In fact, productivity is the magic elixir to help GDP growth as well, as we discuss in the Topic of the Week on the next page.
Credit Market Insights
Noncurrent Loan Balances Up in Q4
Noncurrent balances for bank loans increased 1.3 percent ($1.5 billion) in the fourth quarter, according to the FDIC Quarterly Banking Profile released Tuesday. This recent uptick marks a departure from trend after six consecutive quarterly declines, which collectively shaved off $26.4 billion in noncurrent loans.
Real estate contributed most of the increase in noncurrent loans. Noncurrent residential mortgages rose 5.2 percent ($2.8 billion) for the first increase since Q3-2012. Residential real estate makes up just under half of all noncurrent loans, so changes in this segment have a large influence on the headline. Noncurrent credit card balances also increased, up 11.5 percent ($1.2 billion), but noncurrent commercial and industrial loans fell 8.5 percent ($1.7 billion).
Bank balance sheets continue to show underlying strength. Total loan balances at banks increased 1.7 percent in Q4, with growth across nearly every category. This kept the noncurrent loan rate at 1.2 percent, the lowest level since Q3-2007 and down from 1.42 percent a year ago. The coverage ratio of loan-loss reserves to noncurrent loan balances declined slightly to 106.3 percent, but has been above 100 percent for the past three quarters.
We expect the Fed to raise rates three times in 2018. This environment may put pressure on borrowers’ ability to afford payments. However, bank balance sheets look to be in a position to absorb further modest increases in noncurrent loans at this point.
Topic of the Week
Potential Growth: As Easy As One-Two-Three?
Last summer, we published a report detailing the challenges to achieving 3 percent real economic growth on a sustained basis, and last week’s release of the Economic Report of the President offered another opportunity to revisit the outlook for potential growth.
In the short-run, aggregate spending drives economic growth. It is from the demand-side that economists derive the well-known equation C+I+G+NX=GDP. Over the long-run, however, growth is driven by an economy’s capacity to produce goods and services. Labor force growth and the growth in the productivity of these workers determine an economy’s productive capacity.
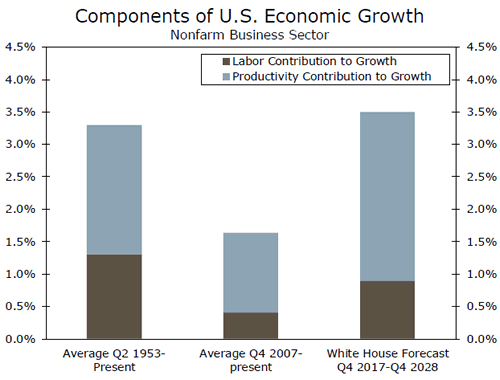
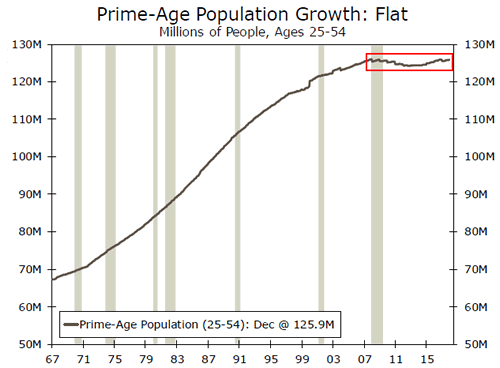
The Economic Report of the President showed the assumptions that underpin the Trump administration’s 3 percent growth forecast. As illustrated in the top chart, a return to historical growth rates for hours worked and productivity would lift potential growth to 3 percent. The challenge, however, is that today’s demographic profile looks vastly different than the previous half-century. The prime-age population in the United States has more or less been flat for the past decade (bottom chart). The administration’s own estimates, which include a positive labor response from the tax plan, do not expect labor’s contribution to growth to return to the historical average. The prospect of tighter immigration laws represent another potential downside risk to the labor component.
If labor’s contribution will be lower in the future than in the past, productivity growth would have to make up the difference. Indeed, the White House projects productivity growth of 2.6 percent per year over the next decade, above the 2.0 percent averaged since 1953 and the 1.2 percent averaged since 2007 (top chart). We concur that productivity growth is likely to rise from its current pace as stronger investment spending drives capital deepening and total factor productivity accelerates from historic lows. We remain skeptical, however, that productivity growth will swing from one extreme to the other, which is what would be needed to sustain 3 percent GDP growth.