
It’s sometimes a hard sell for economists at client meetings to describe the long term forecast of the American economy as no better than 2%. How can this be? Corporate tax rates have been slashed, productivity is rising and the government has never primed the pump more during an all-out economic expansion. Yet, the consensus for economic growth over 2020 to 2022 averages just 1.8%. Further confirmation came from the CBO last week following their analysis of fiscal measures that placed GDP projections within the 1.5-1.8% range from 2020-2028. This is because fiscal policies have yet to change the arithmetic that anchors U.S. growth prospects. I often refer to this as the DNA of an economy – its inherent structure.
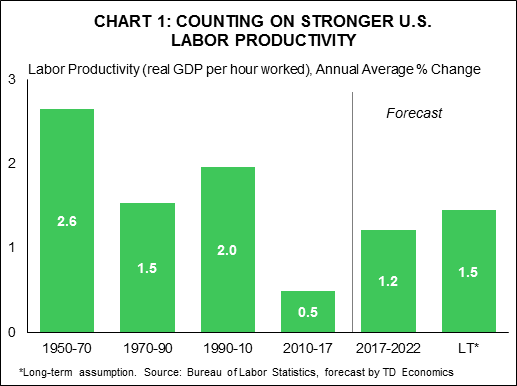
Yes, productivity is improving and expected to continue to do so. In fact, our forecast embeds a growth rate that is at least double that of the past five years (Chart 1). So when people ask us if advances in the digital economy are represented in the forecast, the answer is YES. In fact, we are desperately counting on a persistence of stronger productivity growth, otherwise the economic tendency ends up within a more meagre range of 1% to 1.5%. Of course, there is always the potential for productivity to surprise to the upside on our expectation. However, in order to push GDP to 3% and, more importantly, sustain it there, productivity would have to perform similar to the 1950-1970 period. These were different times, embodying a sharp ramp-up in the labor force’s educational attainment coupled with meaningful advances in the quality of life.
 There are two elements to this economic chromosome, and each is just as important as the other. Fiscal policy has not addressed the realities of demographics and its impact on the labor force. Many of our readers are well aware that the U.S. is faced with an aging population, just like most advanced economies in the world. But, what’s less appreciated is the speed at which this is occurring.
A while back I heard a reference that really stuck with me as an apt characterization. We’re at the point in population dynamics where there will be more diaper sales to adults, than babies.
So, even with heftier productivity estimates boosting GDP growth, there is a large counterweight coming from a slowdown in the labor force due to demographics. And, if you’re wondering if our estimates take into account higher participation rates in the workplace from longer attachment of the older population, the answer is YES.
There you have it; all the pumping and priming of the fiscal pump via taxes and budget expenditures have not addressed a critical genetic component of the economy. But, similar to a biological chromosome, the economics can be changed with time…through policy.

Options On The Table
There are a few ways to tackle the demographic time bomb. A first instinct may be to encourage greater domestic population growth through higher birth rates. This is a tall order where few countries have found success. China stands out as an extreme poster-child on this. In 2013, they relaxed one-child policies set in the late 1970s, and have continued to implement further adjustments only to find that the government repeatedly overestimates the willingness of households to increase their family size. For example, the birth rate rose in 2016 to 1.30% from a five year average of 1.21% after the official two-child policy came into effect at the start of that year. It has since fallen back to 1.24%. Furthermore, Chinese demographic experts believe that the demographic dividend from the policy change is likely done.1 This is not all together surprising since considerations around family are deeply rooted in social and cultural beliefs, alongside economic considerations. There’s no fiscal tool that can easily address all of these factors and, even if successful, there would be a long time lag of at least one generation to feed through to the labor market.
Casting An Eye Overseas
However, there are other paths where policy can boost growth prospects in a shorter timeframe to at least mitigate the downside to the labor force. Let’s start with the most politically sensitive of these: immigration. Most of the U.S. political dialogue has been on limitations for immigrants rather than expansion. Currently, the U.S. allows over a million immigrants per year. This may seem like a large figure, but it’s not. Immigration flows in 2016 amounted to 0.37% of the population base, which is in line with a relatively static average of 0.33% since 2010. Comparing this to other countries from a relative scale perspective, U.S. immigration permits about one-half of that of Canada and the United Kingdom, and about one-third of Germany. U.S. immigration policy is roughly on par with the policies of countries like France and Portugal. At the end of the day, all of these countries face labor force growth challenges similar to the U.S. and are in intense competition for a skilled and adaptable workforce. The most proactive countries implement targeted immigration policy as a stop-gap measure, but in doing so, the scale still doesn’t fully offset aging demographic dynamics.
It’s important to keep in mind that simply boosting immigration flows doesn’t mean a country will align labor force growth to its corporate and entrepreneurial needs. Ideally, policy would not only increase the number of people flowing in, but attract those of a working age and with a composition of education, skills or experience where labor force demand is intensifying. In this regard, U.S. policy can be improved.
Immigration currently relies heavily on whether the applicant is an immediate relative of a U.S. citizen. In the 2016 fiscal year, 68% of permanent resident admissions were either family-sponsored or an immediate relative of a U.S. citizen. Employment-based admission amounted to roughly 12%, or the third largest entry category, with the majority of these classed as priority workers. Investor class immigrants were 0.8% of total resident admissions.
Now compare this to a country like Canada. Through the implementation of a merit-based system, Canada is aiming for 310,000 immigrants in 2018, of which 177,500 will be approved via economic entry. In a simplified form, an economic class for entry involves a point system based on a combination of many factors, including language, education, work experience, secured employment, age and adaptability. The latter offers a broader range of characteristics, including awarding points to applicants with a spouse or common-law partner who is also applying for immigration and meets some of the characteristics, or an applicant with prior educational experience within Canada. In truth, not all of those targeted 177,500 immigrants will enter Canada via the economic class. In the past, just over half were selected as a close family member of the applicant. Doing so helps with the success, permanency and adaptability of a newcomer to a country.
However, even Canada’s merit-based system and higher immigration inflows are not a panacea for its demographic and economic challenges. Very often, newcomers face difficulty having their prior skills, work experience and education fully recognized and integrated into the workforce of their new home.
The merit-based system does not mean it requires skirting responsibilities towards refugees or other distressed groups. In this regard, Canada accepts more refugees as a share of the population or immigration flows (17% of 2016 immigrants) than the U.S. (13% of immigrants characterized as refugees and asylum seekers). Immigration goals need not be mutually exclusive. With the understanding and acceptance that the population base is eroding the growth of the labor force, both the number and skill level of immigrants can be raised, without necessarily requiring a give-back in areas of humanitarian need and leadership.
Tapping Into Your Backyard Potential
Let’s assume that altering immigration policy is simply too politically charged to be used as a primary tool to materially boost the labor force. Is there another path of least resistance? The answer is yes. The gold standard would be to attract the needed skilled workers from other countries, while also simultaneously fully leveraging the workforce already within your borders. But, the latter does offer the lowest hanging fruit on the policy front.
Chart 3 shows that U.S. female participation rates have been in decline for much of the past two decades. This trend is at complete odds with the international experience, despite having educational attainment rates that are on par or higher relative to international peers.
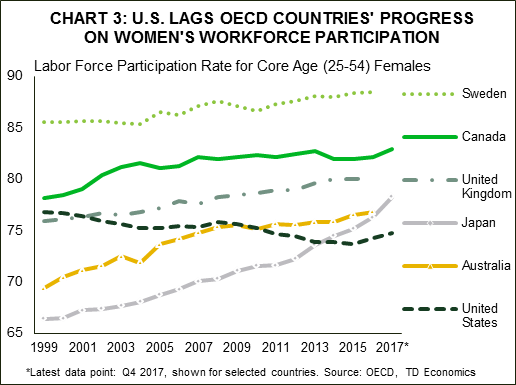 U.S. labor force growth is already decelerating materially due to aging demographics. Reinforcing that pattern further via a counterintuitive decline within the core-working aged female population simply cannot be afforded in this environment. Of interest, if female and male participation rates converged in the U.S., it could lift the level of real GDP by close to 10%.
So what gives? Over the years, parental leave policies have been enhanced in every country except within the United States. In fact, it’s fair to say that the U.S. is stuck in a time warp dating back to the Family and Medical Leave Act (FMLA) established by President Clinton in 1993. The FMLA provides workers with 12 weeks of unpaid, job-protected leave for the birth and care of a newborn child or the adoption or fostering of a newly placed child (parental leave). This similarly holds for family care or medical leave. This law was a first step that has not evolved to the needs of the population.
Among the shortcomings, FMLA does not apply to all employees. Companies are exempt from participation that have fewer than 50 staff, leaving roughly 60% of the workforce eligible for the protection it offers.6 In addition, the FMLA lacks a critical component: paid leave. Its absence has been demonstrated in large amounts of research to be a deal-breaker for many trying to navigate work and family responsibilities.
Surprisingly, the U.S. is the only advanced economy that does not provide a statutory right to paid leave at the federal level. Not surprisingly, this helps perpetuate low female participation rates in the labor force relative to peer countries.
According to researchers at the NBER in 2012, about 28% of the decline in female labor force participation in America relative to other countries in the OECD can be explained by the lack of family-friendly workplace policies, including paid parental leave.7 Some states have stepped up efforts to offer more inclusive policy prescriptions of paid leaves, such as California, New Jersey, Rhode Island and, more recently, New York. But, the lack of a nationwide strategy limits the consistency of benefits, awareness and take-up rate. For instance, California’s paid family leave policy was implemented in 2004, and ten years later the take-up rate by eligible mothers ranged from 25 to 40%.
Looking at it another way, the impact of paid-leave policies is evident in Chart 3. Female participation rates between Canada and the U.S. were near-identical until the year 2000. Thereafter, the U.S. not only fails to keep pace, but actually declines. It’s no coincidence that in December of 2000, Canada increased paid parental leave benefits from 10 to 35 weeks, and lowered the threshold for eligibility from 700 to 600 hours of insurable employment.9
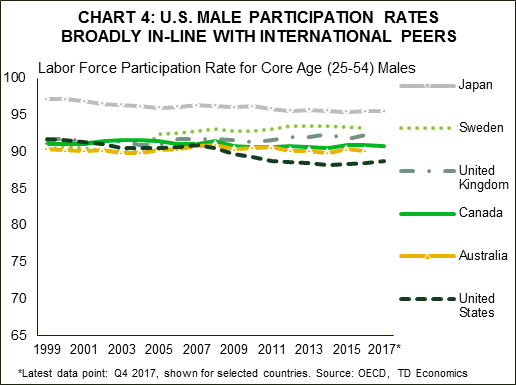
In a world of an increasing share of dual income households and shared family responsibilities, paid parental leaves should be exactly that…parental. It should be up to both parents to decide on what makes the most sense for their household regarding a paid leave. This may also help stem the tide of falling male participation rates, which is the other juggernaut of the U.S. labor force. However, the best bang for the immediate buck is to target women given intensifying demographic pressures and international evidence of its effectiveness. Of note, U.S. male participation rates are also lower than a number of international peers (Chart 4), but remain elevated relative to women. In addition, downward pressure on male participation rates is not a uniquely American phenomenon. It has been occurring across a number of advanced economies due to a myriad of factors, including the impact of automation. In contrast, the downward trend of female participation rates is a uniquely American phenomenon. Research and peer country analysis demonstrate that if women, and specifically, new mothers, remain attached to the labor market, this attachment is persistent over time. This claim was substantiated within the recent research by Goldin and Mitchell.10 Analyzing labor market attachment across age cohorts and over time, they found that 77% of those who worked more than six of the years when they were within the 25-34 age bracket went on to work roughly 80% of the period between the ages of 35-44. Likewise, a similar percentage carried through when they became 45-54 years old. In contrast, among those who departed the labor market with five years or less experience over the 25-34 year old age bracket, only 32% were employed more than 80% of the time between the ages 35-44 years. Simply put, remaining in the labor market for longer periods at a younger age resulted in a significant persistence of labor market attachment in the 20 years that followed. This highlights the importance of policies that encourage life-cycle employment.
 Let’s now dovetail back to why paid-leaves are important to this outcome of job market persistence. This same study demonstrated that since the 1990s, those mothers on paid leave have the highest employment rates before, during and after pregnancy, followed by those on unpaid leave. The gap is quite stark. Those who had access to paid leave had a participation rate of 82% ten years after the birth of their first child. This compares to those who quit during their pregnancy, and showed a labor market participation rate of only 64% ten years later.
Returning to a comparison of Canada and the U.S., Chart 5 shows a large and widening wedge in participation rates among mothers with young children. Greater spending in labor market programs can drive greater attachment over the long term, create a more diverse labor market and mitigate the economic downdraft from an aging population.

Conclusion
At the end of the day, there are only two levers to pull to permanently boost U.S. economic growth: productivity and labor force growth. Recent corporate tax cuts should help to improve the former, while personal tax cuts could incent more workers into the labor force. But, these alone will offer an insufficient thrust to return U.S. GDP growth to the 3% mark – on a sustained basis – against a strengthening demographic headwind. There are solutions for greater labor force growth that aren’t exactly wild cards.
There are plenty of international models that demonstrate the effectiveness of social policies to drive greater female labor force engagement that pays dividends in both the shorter and longer term. Perhaps the biggest example comes from Japan, where family friendly and social policies enacted by Abe in 2013 took the female participation rate from 73.6% to 78.3% in just four years.
Policymakers have a key role to play in moving the dial to bolster labor market participation. The first consideration should be given to leveraging the talent, education and population within your borders, and this requires encouraging labor force attachment from the get-go of entry. The second consideration is to revisit immigration policy and assumptions to help backfill the needed skills, as domestic population availability alone may not fully push against aging dynamics and needed employer skills. In the absence of bolder, proactive initiatives to drive labor force growth, the country’s economic DNA will ultimately rule the day.


