
Highlights
- Sovereign 10-year bond yields in the U.S. and Canada have risen dramatically over the last month in comparison to their global market peers. This is largely due to improvements in inflation that are solidifying the upward path for central bank policy rates and increasing pressure on the term premium.
- At the same time, we are seeing a continuation of the flat yield curve. Contrary to what you may have been hearing, a flat yield curve in the middle of a rate hiking cycle is normal. Over the coming years, we would expect the curve to flatten even further as central banks raise policy rates.
- In the environment of a flat yield curve, it is not surprising that we are experiencing kinks in various tenors. This was on full display last week when the Canadian 30-year inverted with the 10-year. Flatness across the entire curve means that supply and demand factors can put pressure on yields, causing them to cross one another temporarily. What is important is that this is not a recession warning, yet.
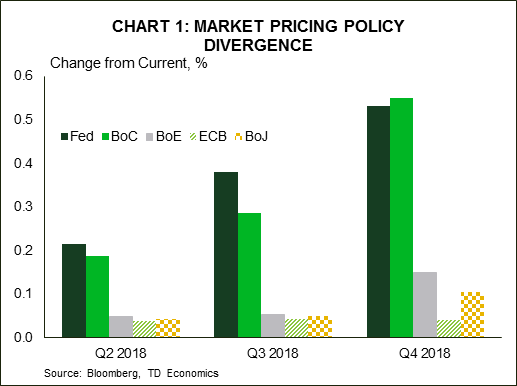
Over the last month, we have seen a weakening in the typically parallel moves in international bond yields relative to the U.S., with the exception of Canada. A tight correlation typically exists with Canada, but it’s being reinforced this year by the fact that the two countries share similar economic backdrops. They are two of the few countries where inflation has already moved towards their central bank 2% targets, where central banks are engaged within an active rate-hiking cycle (Chart 1), and where economic slack is at a minimum, if there is any at all. In contrast, international peers like Germany, the U.K., and Japan are lagging on some or all of these fronts. This has caused their long-term sovereign yields to not rise in step with their American counterparts. This separation reflects the fact that investors are applying a more discerning lens to unique country data and risks. Recent poster-children of this lens are Argentina and Turkey, where heavy foreign indebtedness and insufficient foreign reserves have left them exposed to capital outflow. Readers should take comfort in the fact that the return to volatility more broadly since the start of the year results in exactly this behavior. Importantly, it’s not a bad thing to see, as it ensures complacency does not set and cause market risks to become magnified down the road. We draw comfort from a discerning investor, provided capital movements are not rooted in a fear-based reaction that is blindly applied to a broad swath of undeserving countries.
Inflation driving yields
Markets have been responding in recent months to inflation returning back to central bank targets in the U.S. and Canada. The Federal Reserve’s (Fed) preferred metric, core PCE is at 1.9% and the average of the Bank of Canada’s (BoC) three core inflation measures is at 2.0%. Market pricing around rate increases has solidified for these central banks, which has translated in an upward shift in the short-end of the yield curve (i.e., 2-year tenors). At the same time, softer data in Europe has eased market expectations around rate hike timetables for the European Central Bank (ECB) and the Bank of England (BoE). Consequently, sovereign 2-year yields have failed to follow their North American peers. This is also one reason why the Canadian dollar has held within a firm range against the greenback, while the euro and the pound have broken down, depreciating over 5% from recent peaks versus the USD.
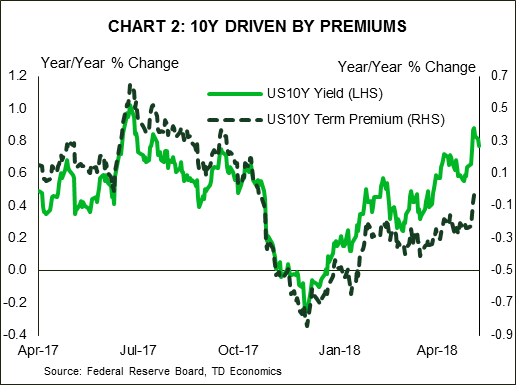
An inflation story is playing out in longer tenor yields as well. Both U.S. and Canadian 10-year yields have jumped more than 30 basis points since the start of April. The move has caused the UST 10-year to break confidently through the psychological 3% barrier. With inflation higher, investors are demanding a greater premium for locking into 10 years of fixed cash flows. Though still low, this term premium has accounted for nearly three-quarters of the UST 10-year’s increase over the last two months (Chart 2). With inflation pressures unlikely to abate (and in fact skewed to the upside), and central banks expected to move interest rates higher through 2019, term premiums should continue to edge higher. This would translate into 10-year yields moving towards 3.3% in the U.S. and 2.8% in Canada by the end of 2019.
The slope of the yield curve to remain flat
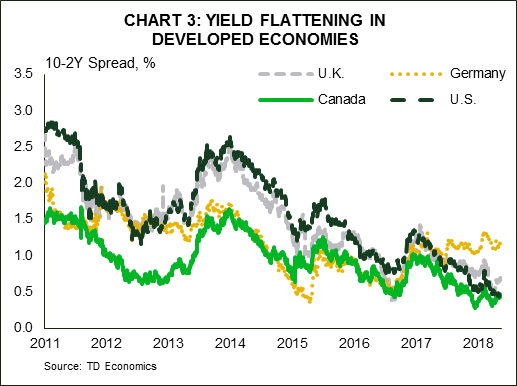
Putting the pieces together, rate hike cycles correspond to flatter yield curves. The U.S. 10-year and 2-year spread has shrunk from roughly 133 basis points at the beginning of 2017 to around 40-50 basis points today (Chart 3). And, we suspect it will slim down further to within a 30-35 basis point range. Our clients often ask whether the narrowing spread is signaling recession. It is not, at least, not yet. Spread narrowing is a very common, and a necessary, facet of a rate hiking cycle for two reasons:
1. The response of long-tenors:
The 10-year yield is a reflection of market expectations 10 years out for the policy rate. For this reason, the forward-looking market typically causes the 10-year yield to make its largest adjustment at the beginning of the rate hiking cycle, and then grind up more slowly as the central bank continues raising rates. That’s why we see a smaller step-up from here for the UST 10-year yield now that it’s already crossed 3%. This would place long-yields at what we call a “terminal yield”, which is rooted in our view of the endpoint for the Fed policy rate (inflation and r*) and a normalization of the term premium (interest rate risk and supply/demand factors). Differences in 10-year forecasts across countries will reflect our view of these factors. For example, we believe that the UST 10-year will end the cycle at a higher level than the Canada 10-year because the running speed for economic growth is a bit higher in the U.S (amongst other factors).
2. The response of short-tenors
During this hiking cycle, shorter tenors that closely reflect the policy path (i.e., the UST 2-year) will steadily rise. The 2-year will typically peak when the central bank has stopped raising policy rates. The 10-year/2-year spread will narrow as the 2-year catches up to the 10-year. The current narrowing in the spread is what we would expect. With the Fed, BoC, and BoE all having initiated rate hiking cycles, the yield spreads for the associated sovereigns have narrowed significantly. In the case of the U.S. and Canada, the 10-year/2-year spreads for both sovereigns have narrowed the most and should remain narrow over the next twelve-to-eighteen months.
Supply and demand cause kinks in the yield curve
As the curve flattens, there is less margin for error when supply factors enter the equation. In other words, oddities may appear with greater frequency. Case in point, up until two weeks ago, the Canada 30-year yield relative to the 10-year was separated by a mere 8 basis points. So, when the 30-year yield actually inverted with the 10-year a week ago, this caused media headlines to flash…”yield inversion takes hold in Canada”. Naturally, this raises a red flag in the mind of investors as to whether this is an early warning signal of recession. The answer is no. Supply side factors are at work here, and recession signals generally hail from an inversion of the 10yr-2yr spread, not just the long end. On that note, the spread remains healthy at around 40-50 basis points, similar to the United States.
The long-end inversion likely occurred due to high demand for long duration assets at a time when supply is not keeping up. The 30-year spread to the 10-year in the U.S. has also flattened dramatically due to issuance preference by the Treasury towards short duration. But, given that the U.S. government is running sizeable deficits relative to Canada, the U.S. Treasury will have to ramp up supply in the market. As a result, it is no wonder that U.S. spreads are a little wider. In addition, for the Canada 30-year, there may be seasonal, technical factors at work in the months of May and June, when history has shown demand and supply to be particularly uneven due to timing of bond issuance. The bottom line is that narrow spreads between short and longer tenures can cause misleading signals on data quirks, and so this too will require a more discerning eye from the investor.
Expect more of the same with bond yields
Looking forward, as central banks continue the normalization of interest rates, we expect the continued flattening of yield spreads and for media headlines to remain fixated on whether warning signals are being flashed. We too will be scrutinizing the data because yield inversions are indeed good leading indicators of recessions, albeit imperfect. That said, when certain parts of the curve are at such narrow spread levels already, issuance preference can cause volatility. Just looking at yields may cause one to think that governments would desire to issue in the long tenors of the yield curve, but the trend has been towards short duration. This preference limits upside for the 10 and 30-year, but increases the ceiling for the 2 and 5-year. Until this changes, expect spreads to remain tight.


