EUR/USD
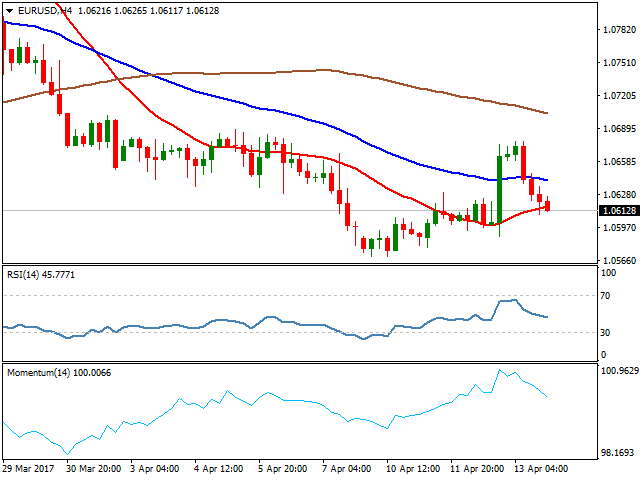
The EURUSD pair fell on Thursday and pared most of gains from late Wednesday’s rally, inspired by comments from the US President Trump. The rally stalled at 1.0675, capped by 55SMA and left double-top after repeated upside rejection followed by fresh bearish acceleration. Quick reversal was triggered by profit-taking action at the end of holiday-shortened week and retraced 76.4% of Wednesday’s 1.0588/1.0675 rally. Also, fresh strength of the US dollar was sparked by solid US weekly jobless claims data that boosted the greenback which was previously hit by Trump’s comments that the US currency is too strong and that he prefers low interest rates. US weekly jobless claims were unchanged from the previous week at 234K and holding near 44-year low at 227K, posted in February, signalling that US jobs sector is on the right path.
EURUSD’s rally failed to regain pivotal 1.07 resistance zone to trigger stronger recovery and fell back below previous pivot at 1.0624 (100SMA), also denting the top of daily Ichimoku cloud at 1.0614 and bringing near-term technical studies back to negative mode that increases risk of further weakness.
Increased downside risk is also backed by negative daily studies.
Due to Good Friday holiday on Friday, money markets are expected in thin volumes environment, with release of US inflation and Retail Sales data, expected to move markets on releases away from forecasted levels.
Retail Sales are expected to fall in |March, according to -0.1% forecast against February’s 0.1% increase, while annualized CPI is forecasted at 2.3% in March vs 2.2% in Apr, which could be good signal for Fed about decision of next rate hike.
Support: 1.0608; 1.0588; 1.0570; 1.0525
Resistance: 1.0623; 1.0663; 1.0675; 1.0700
USD/JPY
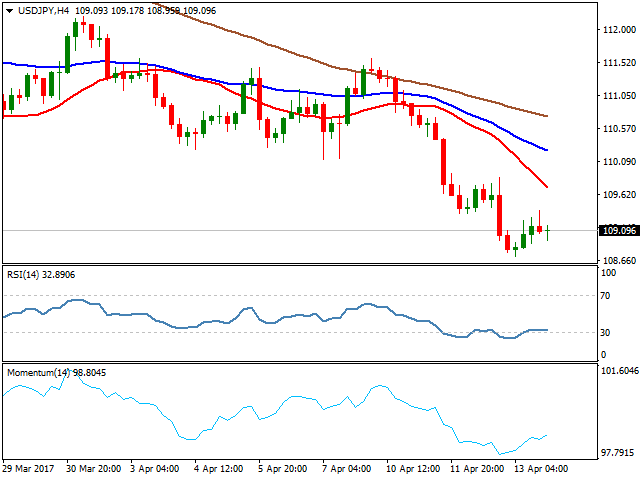
USD JPY currency pair ended Thursday’s trading in green, but gains were limited after the pair extended strong fall of previous two days to 108.72, where 200SMA offered solid support and paused bear-leg from 111.57 (Apr 10 high). Technical studies remain bearish on daily chart, favouring break below 200SMA footstep and extension of the wave C ( the third wave of five-wave descend from 118.60 peak) towards its 100% Fibonacci expansion at 108.48 and 107.86 (Fibonacci 61.8% of broader bull-trend from 101.18 to 118.65) in extension.
Japanese yen remains well support by risk aversion and safe haven buying on growing geopolitical risk that sees potential for yen to gain further against the US dollar.
Recovery attempts on Thursday were limited at 109.38, keeping strong resistances at 110.00 zone (former base, reinforced by falling Tenkan-sen line) intact and keeping risk shifted to the downside, despite oversold daily studies.
Only firm break above 110.00 barrier would sideline downside risk in favour of stronger correction.
Support: 108.72; 108.48; 107.86; 106.73
Resistance: 109.38; 110.10; 110.48; 110.90
GBP/USD
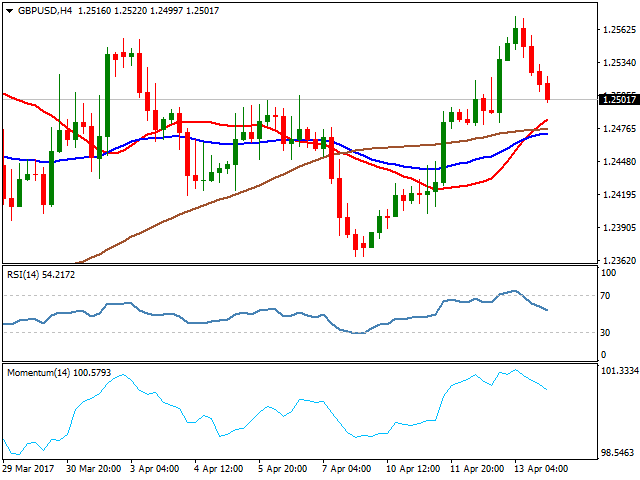
GBPUSD pair ended Thursday’s trading in red, leaving bearish daily candle with long upper wick, after strong three-day rally extended on Thursday to fresh two-weeks high at 1.2574, but failed to hold gains. Subsequent easing returned to 1.2500 zone (former pivotal barrier) where it ended trading for Thursday. Pullback was also boosted by fresh strength of the dollar, but pullback could be seen as correction of larger rally, as pound received strong support from solid economic data this week and technical studies remain in strong bullish setup. Correction faces good support at 1.2466 (20SMA) which is expected to ideally contain dips ahead of fresh push higher. However, extended downticks cannot be ruled out, with next set of solid supports at 1.2426/17 (converged 55/100SMA’s) seen containing.
Bulls are still focusing targets at 1.2615/29 (27 Mar high / 200SMA) and only sustained break below 100SMA at 1.2617 would sideline bullish scenario and turn focus towards higher base at 1.2365 (lows of Apr 07/10).
Support: 1.2480; 1.2466; 1.2426; 1.2417
Resistance: 1.2548; 1.2574; 1.2615; 1.2629
AUDUSD
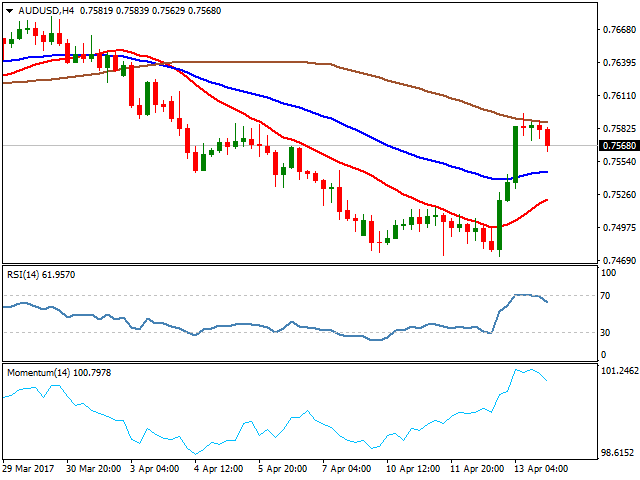
The Aussie dollar was among top winners on Thursday, as it rallied on fresh US dollar’s weakness and accelerated further after upbeat Australian jobs data and better than expected Chinese export / import data which boosted Australian dollar as Australia is one of the biggest China’s trading partners.
Australian employment data showed creation of 60.900 new jobs in March, which was more than tripled from forecast at 20.000 and 2800 new jobs created in February. Australian unemployment remained unchanged in March and came along with forecast at 5.9%.
AUDUSD rallied strongly and took out important barrier at 0.7550 (200SMA), after broken previous pivot at 0.7516 (100SMA) kept the downside protected and underpinned Thursday’s action.
Close above 200SMA will be seen as strong bullish signal, as current rally already retraced over 50% of 0.7675/0.7473 descend and may accelerate further if takes out next pivot at 0.7611 (daily Kijun-sen line).
However, daily studies are still weak and risk of recovery stall will exist if the pair fails to extend recovery above Kijun-sen pivot.
Return below 200SMA would re-activate negative scenario and shift near-term risk lower.
Support: 0.7550; 0.7516; 0.7500; 0.7473
Resistance: 0.7595; 0.7604; 0.7611; 0.7627
GBPCAD
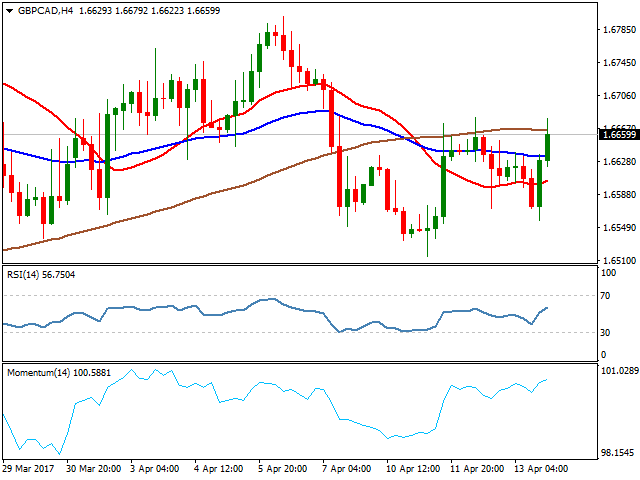
The GBPCAD cross was higher on Thursday and ended trading positively after break above daily Tenkan-sen line (the upper boundary of near-term 1.6657/1.6589 congestion). With daily Tenkan-sen / Kijun-sen lines being in bullish setup and daily indicators holding in the positive territory, near –term bulls are looking for confirmation on break above next pivotal barrier at 1.6691 (200SMA), to open way for extension towards next target at 1.6800 (Apr 6 high).
The pair gained 0.35% on Thursday, as strong rally surged through hourly Ichimoku cloud and turned near-term studies to the bullish mode that would support further upside acceleration
Daily close above Tenkan-sen line will be initial bullish signal.
On the downside, daily Kijun-sen offers solid support at 1.6589, which should hold extended corrective dips.
Support: 1.6638; 1.6600; 1.6589; 1.6557
Resistance: 1.6679; 1.6691; 1.6736; 1.6800
GOLD
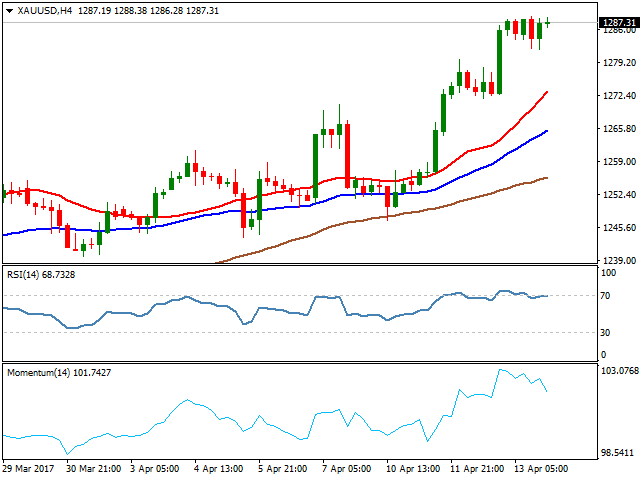
Spot Gold continued to trend higher and hit fresh 5-month high at $1288 on Thursday, being supported by rising tensions over US relations with Russia and North Korea and recent dollar’s fall after US President Trump said that the dollar is too strong. Gold is expected to remain supported as geopolitical tensions sparked risk-aversion in the markets and prompted investors to exit position in riskier assets and move into traditional safe haven gold.
The yellow metal could extend rally through next target at $1293 (weekly Ichimoku cloud top) and attack psychological $1300 barrier in extension.
However, daily studies are overextended and suggest that strong bulls may take a breather, but no firmer bearish signal have been generated for now.
Immediate support lies at $1281 (daily low) ahead of thick hourly Ichimoku cloud which is spanned between $1279 and $1268 and is expected to contain extended corrective dips.
Support: 1281;1279; 1270; 1268
Resistance; 1288; 1293; 1300; 1307
WTI CRUDE OIL
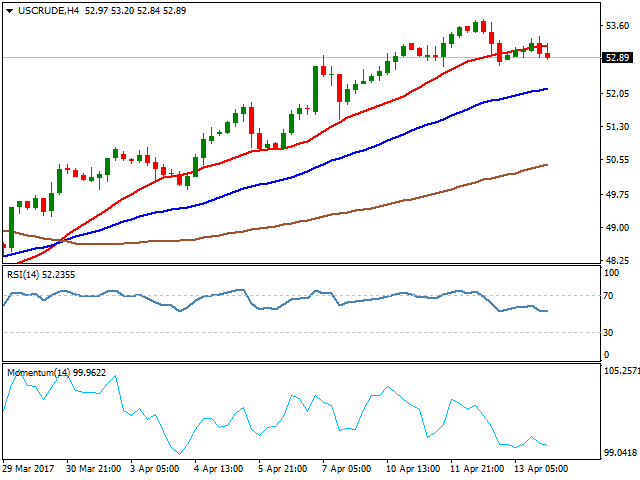
WTI oil ended Thursday’s trading positively, signalling that previous day’s pullback may be over, after dips from fresh five-week high at $53.74 found footstep at $52.70. However, risk of fresh easing remains in play and signalled by overbought daily slow stochastic that is reversing from overbought territory after forming bearish divergence. Loss of immediate support at $52.70 would initial signal of correction which could extend to $52.17 (Fibonacci 23.6% of $47.07/$53.74) and expose pivotal support at $51.66 (converged 55/100 SNMA’s), loss of which would generate stronger correction signal.
Conversely, early downside rejection and return to $53.74 would signal bullish continuation and focus key barriers at $55.00 zone.
WTI contract will shut on Friday for Good Friday holiday.
Support: 52.52.83; 52.70; 52.17; 51.66
Resistance: 53.37; 53.74; 54.50; 55.00
DJIA
Major U.S. stock indexes fell on Thursday for a third straight day, as investors weighed earnings reports from big U.S. banks and geopolitical tensions, while the technical sector fell for a tenth consecutive session.
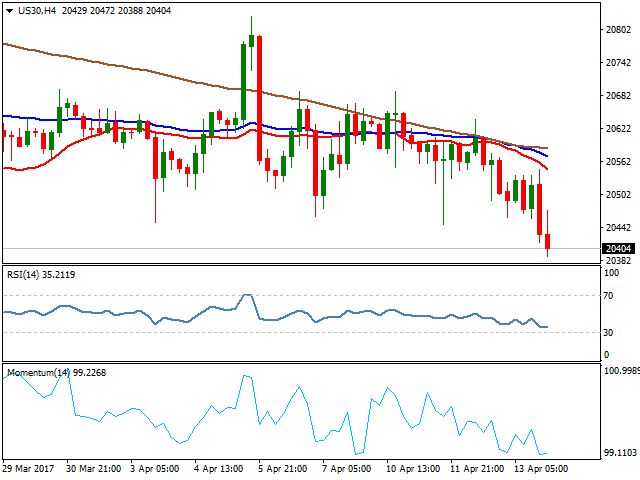
Dow Jones remained in red on Thursday and extended weakness for the second day, hitting target and key near-term support at 20385 (daily Ichimoku cloud base), break of which would generate fresh bearish signal, as index commenced fresh bear-leg after holding in directionless mode during previous two weeks and ended past week in red.
Risk remains shifted to the downside, as bearish technical studies weigh. Extension below daily cloud would open way for extension towards next support at 20266 (Fibonacci 61.8% of 19713/21160 rally).
Dow Jones will be closed on Good Friday.
Support: 20385; 20266; 20200; 20157
Resistance: 20548; 20607; 20692; 20827
FTSE 100
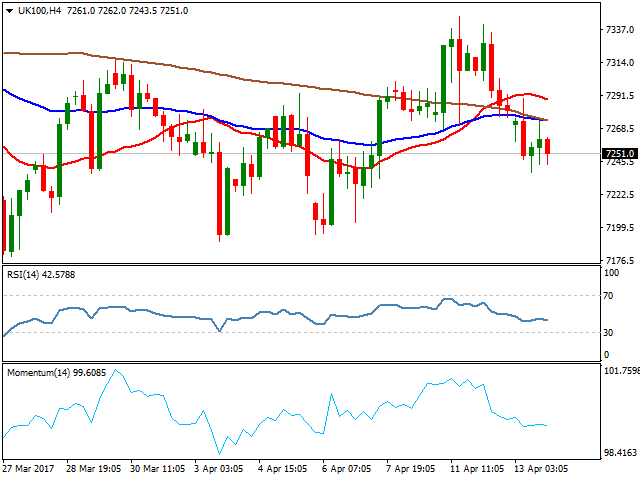
FTSE index remained under pressure on Thursday and closed in red for the second consecutive day, extending below important support at 7268 (daily Tenkan-sen) and hitting key support at 7238 (top of daily Ichimoku cloud which underpins bulls since mid-Dec 2016). Fresh attack at daily cloud is the second one, after false break into cloud one week ago and may generate stronger bearish signal.
Daily Tenkan-sen / Kijun-sen lines are in bearish setup, along with daily indicators entering negative territory and weighing on near-term action, as index closed the week in red.
Focus will be on Monday’s post-holiday opening, as index will be closed on Friday.
Support: 7238; 7203; 7184; 7140
Resistance: 7268; 7289; 7311; 7343
DAX
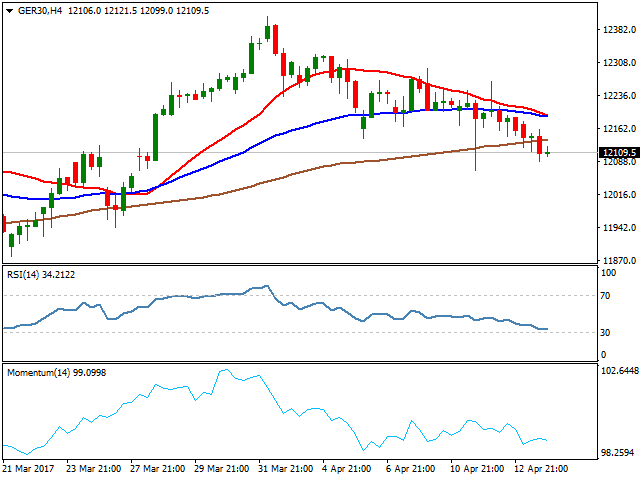
DAX closed in red for the fourth consecutive day and also ended the second week negatively, on extension from fresh record high at 12410, posted on Apr 03. Technical studies are losing traction as the price already cracked 61.8% retracement of 11878/12410 upleg at 12081 that could signal fresh bearish acceleration on break.
Negative sentiment is reinforced by surge through thick 4-hour Ichimoku cloud and sustained break below 12081 handle would expose psychological 12000 support.
Broken daily Kijun-sen line now acts as initial resistance at 12144, while upper breakpoint is marked by daily Tenkan-sen at 12240.
DAX will be closed on Friday.
Support: 12081; 12000; 11943; 11878
Resistance: 12144; 12178; 12207; 12240